Analysis:
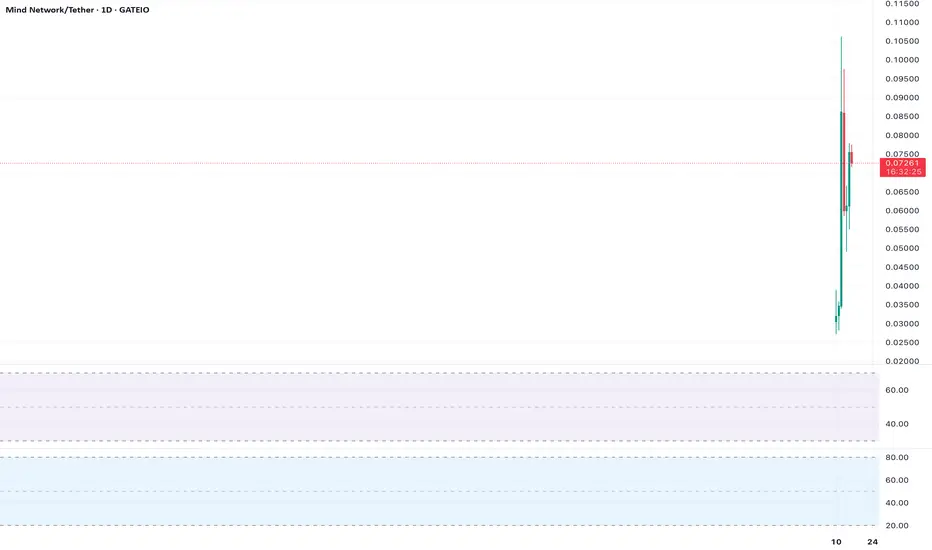
 FHE’s daily chart shows a potential double bottom at $0.00000075, a bullish pattern. The price is at $0.00000079, with RSI rising from oversold levels (30). A move above $0.00000085 confirms the pattern, targeting $0.0000011. Low volume is a risk.
Actionable Insight:
Long on a break above $0.00000085, targeting $0.0000011. Stop-loss at $0.00000074. Confirm with volume before entry.
Chart Setup:
Timeframe: Daily
Indicators: RSI, Double Bottom
Levels: Neckline ($0.00000085), Target ($0.0000011)
Actionable Insight:
Long on a break above $0.00000085, targeting $0.0000011. Stop-loss at $0.00000074. Confirm with volume before entry.
Chart Setup:
Timeframe: Daily
Indicators: RSI, Double Bottom
Levels: Neckline ($0.00000085), Target ($0.0000011)
Disclaimer
The information and publications are not meant to be, and do not constitute, financial, investment, trading, or other types of advice or recommendations supplied or endorsed by TradingView. Read more in the Terms of Use.
Disclaimer
The information and publications are not meant to be, and do not constitute, financial, investment, trading, or other types of advice or recommendations supplied or endorsed by TradingView. Read more in the Terms of Use.