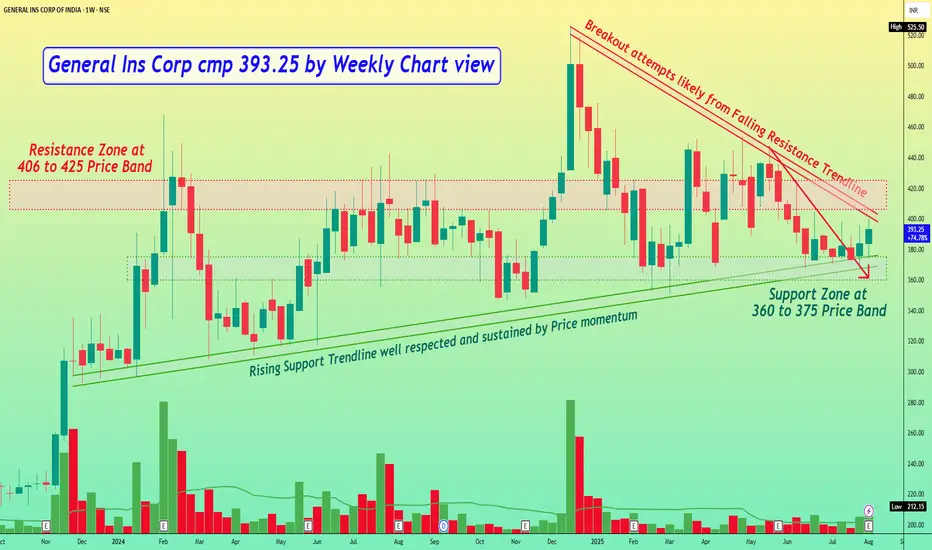
General Ins Corp cmp 393.25 by Weekly Chart view
- Support Zone at 360 to 375 Price Band
- Resistance Zone at 406 to 425 Price Band
- Breakout attempts likely from Falling Resistance Trendline
- Rising Support Trendline well respected and sustained by Price momentum
- Volumes seem well in sync with average traded quantity over the past few weeks
- *Subject to Strong Resistance Zone Breakout happens, it would a good hurdle to crossover*
Disclaimer
The information and publications are not meant to be, and do not constitute, financial, investment, trading, or other types of advice or recommendations supplied or endorsed by TradingView. Read more in the Terms of Use.
Disclaimer
The information and publications are not meant to be, and do not constitute, financial, investment, trading, or other types of advice or recommendations supplied or endorsed by TradingView. Read more in the Terms of Use.