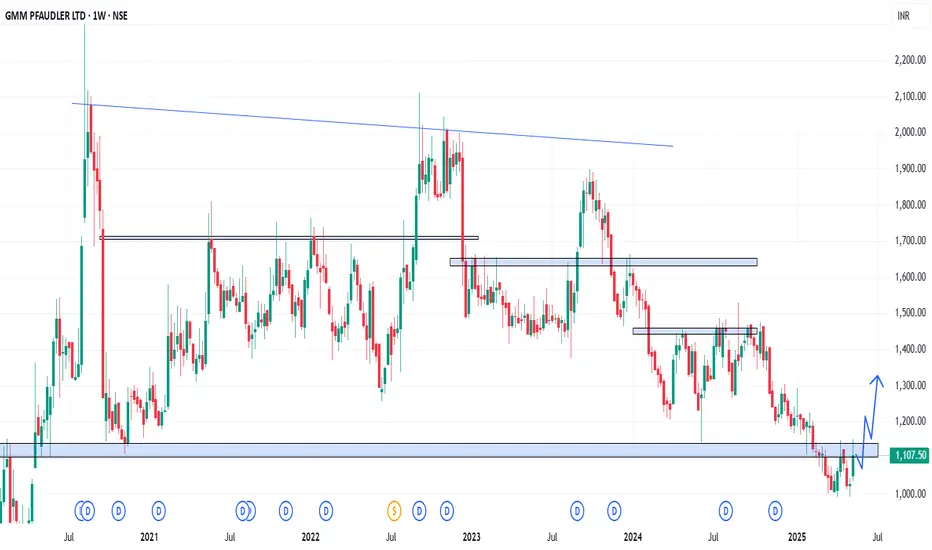
In the Weekly Chart of GMMPFAUDLR ,
we can see that, after strong selling, it is resisting itself.
Let it create a halt candle and then show a strong momentum.
Expected momentum is shown in chart.
we can see that, after strong selling, it is resisting itself.
Let it create a halt candle and then show a strong momentum.
Expected momentum is shown in chart.
Disclaimer
The information and publications are not meant to be, and do not constitute, financial, investment, trading, or other types of advice or recommendations supplied or endorsed by TradingView. Read more in the Terms of Use.
Disclaimer
The information and publications are not meant to be, and do not constitute, financial, investment, trading, or other types of advice or recommendations supplied or endorsed by TradingView. Read more in the Terms of Use.