Go Digit General Insurance Ltd – Descending Channel Breakout Setup
 GODIGIT
📈 Pattern & Setup:
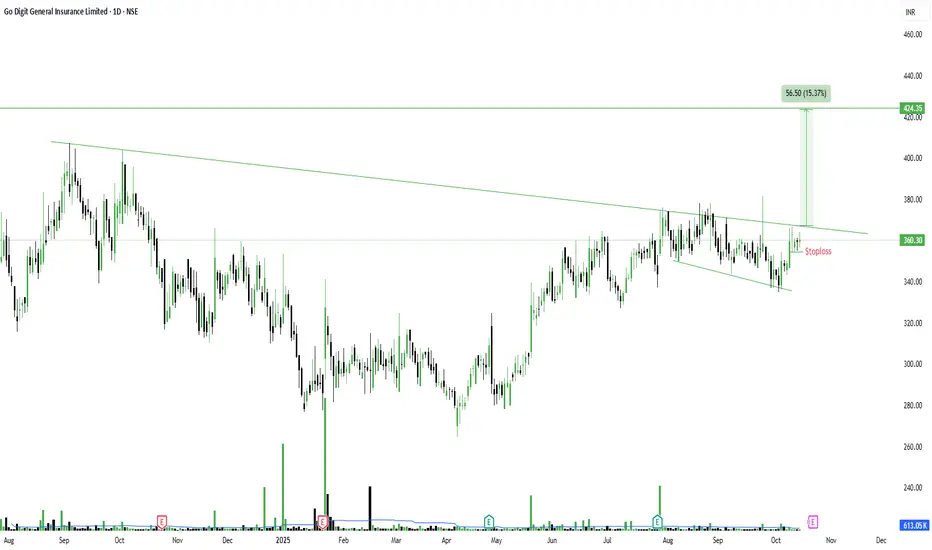
Go Digit is showing signs of a potential breakout from a long-term descending channel. After multiple shakeouts and pullbacks near the lower trendline, the stock has now reclaimed higher ground, moving closer to the upper boundary around 362–365.
The repeated pullbacks with strong recoveries highlight steady accumulation by smart money. Price compression within this narrowing channel is indicating that supply is drying up. A strong breakout above 368–370 with volume could confirm the start of a fresh rally toward 420+.
📝 Trade Plan:
✍Entry: Above 370 (breakout confirmation)
🚩Stop-Loss: 345 (below the recent higher low)
🎯Targets:
Target 1 → 395
Target 2 → 424 (15% potential move)
💡 Pyramiding Strategy:
1. Enter 60% above 370
2. Add remaining 40% once price sustains above 380 with heavy volume
3. Trail stop-loss to 355 once the price crosses 390
🧠 Logic Behind Selecting this Trade:
The price action structure suggests that sellers are gradually losing control while buyers are stepping in near support. The consistent pattern of pullbacks followed by rebounds shows quiet institutional activity. A confirmed breakout from the channel could trigger a sustained move as trapped sellers start covering.
Keep Learning. Keep Earning.
Let’s grow together 📚🎯
🔴Disclaimer:
This analysis is for educational purposes only. Not a buy/sell recommendation. Please do your own research or consult your financial advisor before trading.
📈 Pattern & Setup:
Go Digit is showing signs of a potential breakout from a long-term descending channel. After multiple shakeouts and pullbacks near the lower trendline, the stock has now reclaimed higher ground, moving closer to the upper boundary around 362–365.
The repeated pullbacks with strong recoveries highlight steady accumulation by smart money. Price compression within this narrowing channel is indicating that supply is drying up. A strong breakout above 368–370 with volume could confirm the start of a fresh rally toward 420+.
📝 Trade Plan:
✍Entry: Above 370 (breakout confirmation)
🚩Stop-Loss: 345 (below the recent higher low)
🎯Targets:
Target 1 → 395
Target 2 → 424 (15% potential move)
💡 Pyramiding Strategy:
1. Enter 60% above 370
2. Add remaining 40% once price sustains above 380 with heavy volume
3. Trail stop-loss to 355 once the price crosses 390
🧠 Logic Behind Selecting this Trade:
The price action structure suggests that sellers are gradually losing control while buyers are stepping in near support. The consistent pattern of pullbacks followed by rebounds shows quiet institutional activity. A confirmed breakout from the channel could trigger a sustained move as trapped sellers start covering.
Keep Learning. Keep Earning.
Let’s grow together 📚🎯
🔴Disclaimer:
This analysis is for educational purposes only. Not a buy/sell recommendation. Please do your own research or consult your financial advisor before trading.
TrendX INC
Related publications
Disclaimer
The information and publications are not meant to be, and do not constitute, financial, investment, trading, or other types of advice or recommendations supplied or endorsed by TradingView. Read more in the Terms of Use.
TrendX INC
Related publications
Disclaimer
The information and publications are not meant to be, and do not constitute, financial, investment, trading, or other types of advice or recommendations supplied or endorsed by TradingView. Read more in the Terms of Use.