🔹 Pattern Observed
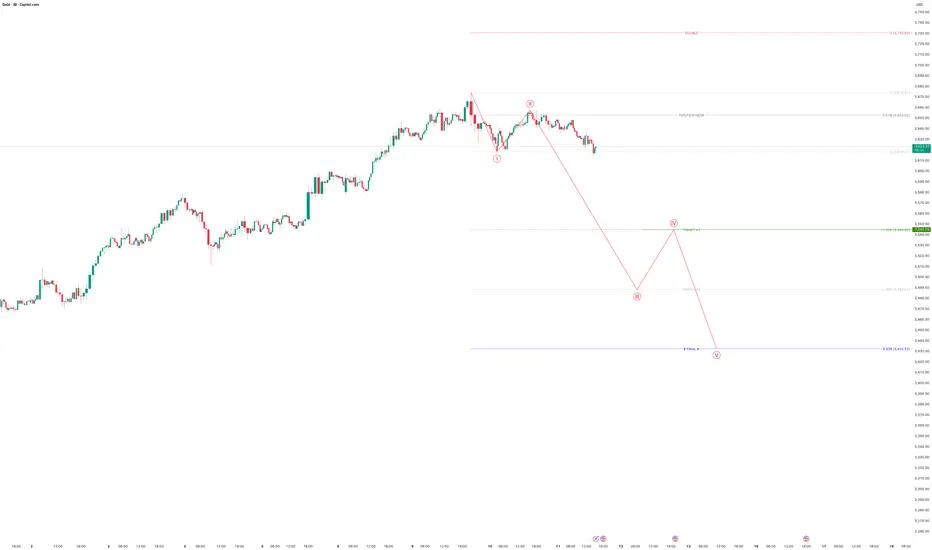
The chart is drawn in Elliott Wave count.
You’ve marked a completed wave (I–II) and projection for III–IV–V downward.
Fibonacci extensions are plotted to project targets.
🔹 Short-Term View
Current price: around 2,628 USD.
Gold looks to have topped and is entering a downward impulse.
Wave III target: around 2,560–2,550 USD.
Wave V final target: around 2,480–2,475 USD (blue fib extension zone).
🔹 Upside/Invalidation
Any sustained move above 2,675 USD (recent swing high) would invalidate the bearish count.
That would imply either extended wave II or a fresh bullish leg.
🔹 Trading Implication
Bias: Bearish while below 2,675.
Entry Zone: 2,625–2,635 (near retracement).
Stop Loss: Above 2,675.
Targets:
T1 = 2,560
T2 = 2,520
T3 = 2,480
This offers ~150–200 point downside against ~50 point risk → 1:3 to 1:4 R:R.
✅ Conclusion
Gold is showing a bearish Elliott Wave setup, with potential for a fall toward 2,480 after breaking 2,560–2,550. Keep SL above 2,675 to protect capital.
⚠️ Disclaimer:
This analysis is provided for educational purposes only. It is not financial advice. Trading in commodities and derivatives carries significant risk of capital loss. Please do your own due diligence or consult a registered financial advisor before making trading or investment decisions.
Disclaimer
The information and publications are not meant to be, and do not constitute, financial, investment, trading, or other types of advice or recommendations supplied or endorsed by TradingView. Read more in the Terms of Use.
Disclaimer
The information and publications are not meant to be, and do not constitute, financial, investment, trading, or other types of advice or recommendations supplied or endorsed by TradingView. Read more in the Terms of Use.