Gold Trade Setup (Based on Trendline, EMA & Order Block Analysis)
1. Trendline Analysis
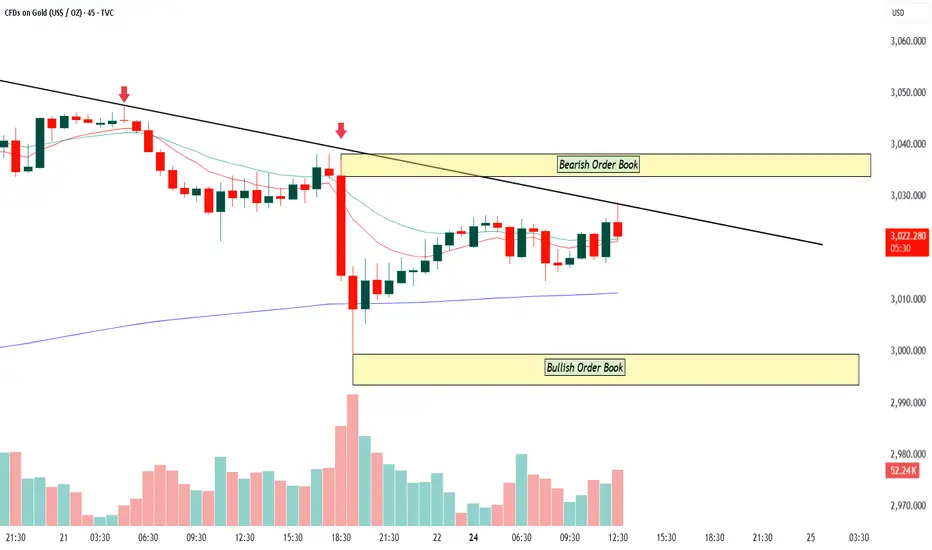
The chart shows a descending trendline connecting multiple lower highs (highlighted with red arrows). The price is respecting this trendline, indicating a downtrend. The most recent price action shows a rejection from this trendline, which strengthens the bearish outlook unless the price can break above it with strong momentum.
2. EMA (Exponential Moving Averages) Analysis
EMA 10 (red) and EMA 20 (blue): EMA 10 is below EMA 20, which confirms a bearish short-term trend. The price is currently attempting to trade above these EMAs, suggesting a possible short-term bullish push. A bullish crossover (if EMA 10 crosses above EMA 20) could signal a trend reversal.
EMA 200 (purple):
The price is trading below the EMA 200, confirming that the overall trend remains bearish. EMA 200 is acting as a strong dynamic resistance, so any upside will face pressure around that level.
3. Order Block Analysis
Bearish Order Block:
Marked at the top around $3,030–$3,040. The price recently touched this zone and got rejected, reinforcing bearish pressure. If the price breaks above this order block with strong volume, it could shift the trend bullish.
Bullish Order Block:
Marked around $2,990–$3,000.
This zone acted as support during the recent sell-off, indicating that buyers are stepping in at this level. If the price retests this zone and holds, it could lead to a bullish reversal.
Summary & Trade Bias
Bearish Bias:
The downtrend is intact with the trendline and EMA positioning confirming bearish momentum. A shorting opportunity could arise at the bearish order block if the price rejects from the trendline again.
Bullish Reversal Potential:
If the price closes above the bearish order block and the EMA 10 crosses above EMA 20, a bullish reversal could unfold. The bullish order block at $2,990–$3,000 is critical for holding bullish momentum.
Bearish Setup:
Entry: Near the Bearish Order Block at $3,030–$3,035 (after price shows rejection at the trendline).
Stop Loss: Above the recent swing high at $3,042.
Target 1: $3,010 (near EMA 200).
Target 2: $3,000 (Bullish Order Block zone).
Risk-to-Reward: ~2:1
Bullish Setup:
Entry: On a confirmed breakout above $3,035 with volume and bullish candle close.
Stop Loss: Below the breakout candle low or $3,020.
Target 1: $3,050 (next resistance zone).
Target 2: $3,060 (upper resistance).
Risk-to-Reward: ~2:1
This analysis is for educational purposes only and should not be considered financial advice. Trading involves significant risk, and past performance does not guarantee future results. You are responsible for your trading decisions—always manage your risk carefully.
1. Trendline Analysis
The chart shows a descending trendline connecting multiple lower highs (highlighted with red arrows). The price is respecting this trendline, indicating a downtrend. The most recent price action shows a rejection from this trendline, which strengthens the bearish outlook unless the price can break above it with strong momentum.
2. EMA (Exponential Moving Averages) Analysis
EMA 10 (red) and EMA 20 (blue): EMA 10 is below EMA 20, which confirms a bearish short-term trend. The price is currently attempting to trade above these EMAs, suggesting a possible short-term bullish push. A bullish crossover (if EMA 10 crosses above EMA 20) could signal a trend reversal.
EMA 200 (purple):
The price is trading below the EMA 200, confirming that the overall trend remains bearish. EMA 200 is acting as a strong dynamic resistance, so any upside will face pressure around that level.
3. Order Block Analysis
Bearish Order Block:
Marked at the top around $3,030–$3,040. The price recently touched this zone and got rejected, reinforcing bearish pressure. If the price breaks above this order block with strong volume, it could shift the trend bullish.
Bullish Order Block:
Marked around $2,990–$3,000.
This zone acted as support during the recent sell-off, indicating that buyers are stepping in at this level. If the price retests this zone and holds, it could lead to a bullish reversal.
Summary & Trade Bias
Bearish Bias:
The downtrend is intact with the trendline and EMA positioning confirming bearish momentum. A shorting opportunity could arise at the bearish order block if the price rejects from the trendline again.
Bullish Reversal Potential:
If the price closes above the bearish order block and the EMA 10 crosses above EMA 20, a bullish reversal could unfold. The bullish order block at $2,990–$3,000 is critical for holding bullish momentum.
Bearish Setup:
Entry: Near the Bearish Order Block at $3,030–$3,035 (after price shows rejection at the trendline).
Stop Loss: Above the recent swing high at $3,042.
Target 1: $3,010 (near EMA 200).
Target 2: $3,000 (Bullish Order Block zone).
Risk-to-Reward: ~2:1
Bullish Setup:
Entry: On a confirmed breakout above $3,035 with volume and bullish candle close.
Stop Loss: Below the breakout candle low or $3,020.
Target 1: $3,050 (next resistance zone).
Target 2: $3,060 (upper resistance).
Risk-to-Reward: ~2:1
This analysis is for educational purposes only and should not be considered financial advice. Trading involves significant risk, and past performance does not guarantee future results. You are responsible for your trading decisions—always manage your risk carefully.
Disclaimer
The information and publications are not meant to be, and do not constitute, financial, investment, trading, or other types of advice or recommendations supplied or endorsed by TradingView. Read more in the Terms of Use.
Disclaimer
The information and publications are not meant to be, and do not constitute, financial, investment, trading, or other types of advice or recommendations supplied or endorsed by TradingView. Read more in the Terms of Use.