Bullish Pennant Breakout in Gold MCX
📊 Pattern Overview:
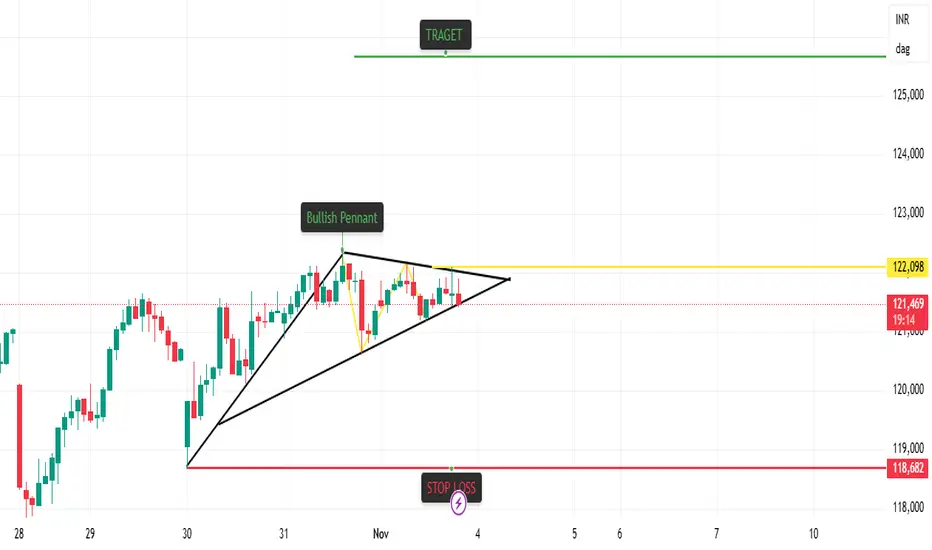
A Bullish Pennant pattern has formed after a strong upward move, signaling a potential continuation of the trend. The pattern is characterized by converging trendlines during consolidation, followed by a breakout to the upside.
📈 Strategy Setup:
Pattern: Bullish Pennant
Breakout Confirmation: Price closing above pennant resistance line
Entry Zone: Near breakout candle close
Target (T1): ₹125,635
Stop Loss (SL): ₹118,682
Risk–Reward Ratio: Approximately 1:2
📊 Indicator Confluence:
T-K Cross: Bullish Cross
Price vs Kijun: Bullish
Cloud Trend: Up
VWMA: Up
RSI: Up
VWAP: Up
SuperTrend: Down (short-term resistance, to be monitored)
🧠 Trading Logic:
The Bullish Pennant indicates a temporary consolidation within an existing uptrend. A confirmed breakout with indicator support (Ichimoku, RSI, VWMA, and VWAP in alignment) strengthens the bullish momentum. Traders may look for sustained candles above the upper trendline with volume confirmation.
⚠️ Disclaimer:
This content is shared for educational purposes only and does not constitute investment or trading advice. Market conditions can change rapidly — always conduct your own analysis and use proper risk management before making any trading decisions.
📊 Pattern Overview:
A Bullish Pennant pattern has formed after a strong upward move, signaling a potential continuation of the trend. The pattern is characterized by converging trendlines during consolidation, followed by a breakout to the upside.
📈 Strategy Setup:
Pattern: Bullish Pennant
Breakout Confirmation: Price closing above pennant resistance line
Entry Zone: Near breakout candle close
Target (T1): ₹125,635
Stop Loss (SL): ₹118,682
Risk–Reward Ratio: Approximately 1:2
📊 Indicator Confluence:
T-K Cross: Bullish Cross
Price vs Kijun: Bullish
Cloud Trend: Up
VWMA: Up
RSI: Up
VWAP: Up
SuperTrend: Down (short-term resistance, to be monitored)
🧠 Trading Logic:
The Bullish Pennant indicates a temporary consolidation within an existing uptrend. A confirmed breakout with indicator support (Ichimoku, RSI, VWMA, and VWAP in alignment) strengthens the bullish momentum. Traders may look for sustained candles above the upper trendline with volume confirmation.
⚠️ Disclaimer:
This content is shared for educational purposes only and does not constitute investment or trading advice. Market conditions can change rapidly — always conduct your own analysis and use proper risk management before making any trading decisions.
Trade closed: target reached
target reached Disclaimer
The information and publications are not meant to be, and do not constitute, financial, investment, trading, or other types of advice or recommendations supplied or endorsed by TradingView. Read more in the Terms of Use.
Disclaimer
The information and publications are not meant to be, and do not constitute, financial, investment, trading, or other types of advice or recommendations supplied or endorsed by TradingView. Read more in the Terms of Use.