The Setup: Breakout from the Base
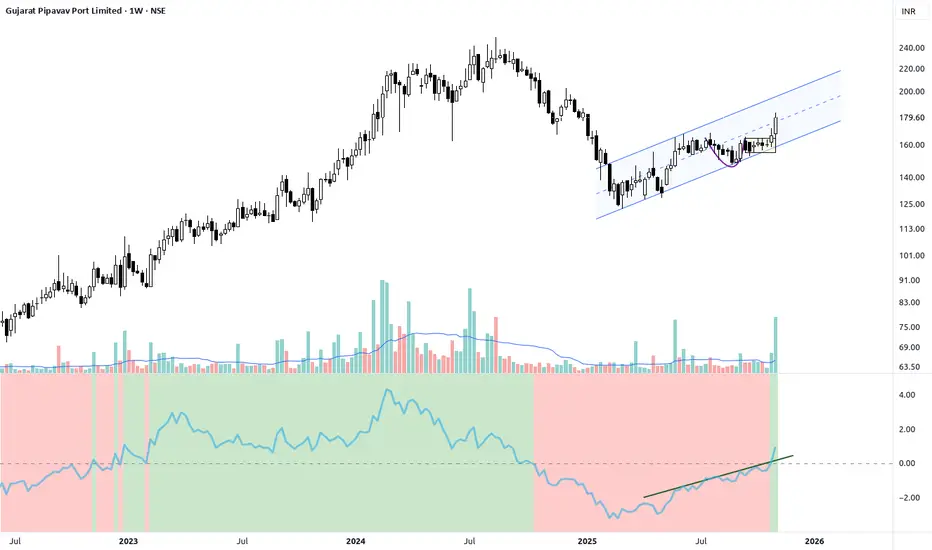
GPPL has spent the last year consolidating after a sharp correction from its 2024 high. The chart shows a strong attempt to transition from a corrective phase into a new uptrend (often called a Stage 1 to Stage 2 transition).
Key Technical Confirmation
The Trade Plan
The trade is a continuation play, betting on the momentum established by the recent breakout.
Potential Risks & Cautionary Notes
#Disclaimer: This is for educational and observation purposes only and is not financial advice. Trade at your own risk.
GPPL has spent the last year consolidating after a sharp correction from its 2024 high. The chart shows a strong attempt to transition from a corrective phase into a new uptrend (often called a Stage 1 to Stage 2 transition).
- The Consolidation: The stock established a wide, multi-month base (roughly between ₹125 and ₹160). This base successfully absorbed selling pressure and built a foundation for the next move.
- The Breakout: The recent move has successfully powered the price above the ₹160 overhead supply zone, confirming the breakout from this major base.
- The Follow-Through: The price is now trading within a bullish channel (indicated by the blue parallel lines) and is holding its momentum well above the former resistance.
Key Technical Confirmation
- Moving Averages: The price is now trading above all key moving averages. Crucially, the short-term MAs (blue and red) have crossed above the longer-term MAs (green and orange), confirming the shift to an uptrend (bullish crossover).
- Relative Strength: The Relative Strength line (bottom panel) has turned positive and is visibly trending upward (the green line). This is a vital sign that the stock is outperforming the Nifty and is becoming a market leader.
- Volume: The breakout from the base was accompanied by a clear surge in volume, validating the institutional interest behind the move.
The Trade Plan
The trade is a continuation play, betting on the momentum established by the recent breakout.
- Entry Signal: Enter around the current weekly close.
- Stop Loss (Risk Management): Place a clear, objective stop loss below the key breakout zone, for example, around ₹159 - ₹169. This preserves a strong risk/reward profile.
- Target Expectation: The initial target is the Weak High near ₹240. If the stock can clear this historical pivot, the potential is for a strong, sustained run into new All-Time Highs.
Potential Risks & Cautionary Notes
- Failed Breakout: The primary risk is if the stock fails to sustain momentum and closes back below the major support at ₹160. This would signal a false breakout and invalidate the current bullish thesis.
- Channel Breakdown: A break below the lower trendline of the current channel structure would be an early warning sign of loss of momentum.
- Sector Volatility: Port and logistics stocks can be sensitive to trade and global economic figures. Be aware of any macro changes that could affect the sector.
#Disclaimer: This is for educational and observation purposes only and is not financial advice. Trade at your own risk.
Disclaimer
The information and publications are not meant to be, and do not constitute, financial, investment, trading, or other types of advice or recommendations supplied or endorsed by TradingView. Read more in the Terms of Use.
Disclaimer
The information and publications are not meant to be, and do not constitute, financial, investment, trading, or other types of advice or recommendations supplied or endorsed by TradingView. Read more in the Terms of Use.