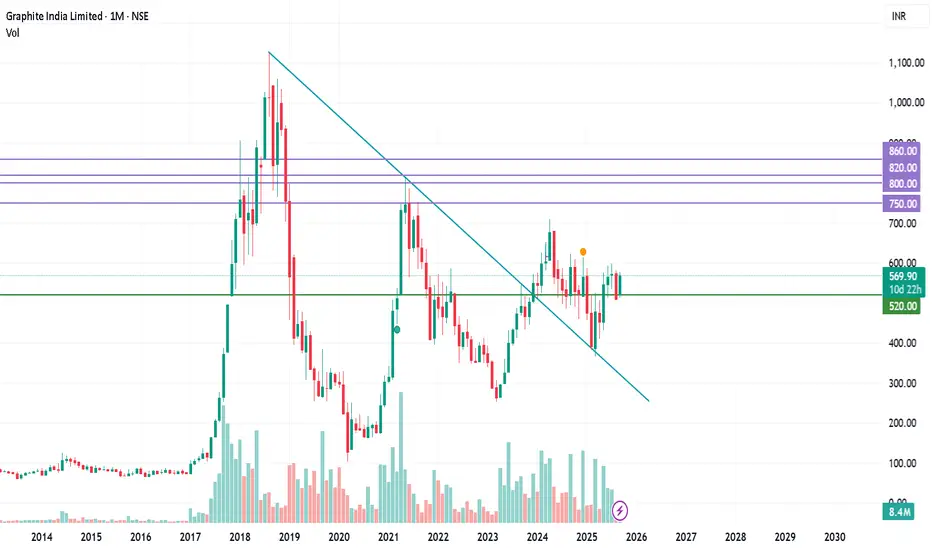
🔺 Descending Trendline Break
- The stock had been in a long-term downtrend since its 2018 peak, forming lower highs.
- Recently, it broke above the descending trendline, which is a classic bullish breakout signal.
- This suggests a potential trend reversal from bearish to bullish.
📈 Strong Monthly Candle
- The breakout candle has a wide range and strong close near the high, indicating conviction.
- Volume is elevated, confirming institutional participation.
🧠 Psychological Shift
- Breaking a multi-year trendline often reflects a change in market sentiment—from pessimism to optimism.
- Traders and investors may now start re-rating the stock, especially if fundamentals support it.
This is only for education purpose.
Disclaimer
The information and publications are not meant to be, and do not constitute, financial, investment, trading, or other types of advice or recommendations supplied or endorsed by TradingView. Read more in the Terms of Use.
Disclaimer
The information and publications are not meant to be, and do not constitute, financial, investment, trading, or other types of advice or recommendations supplied or endorsed by TradingView. Read more in the Terms of Use.