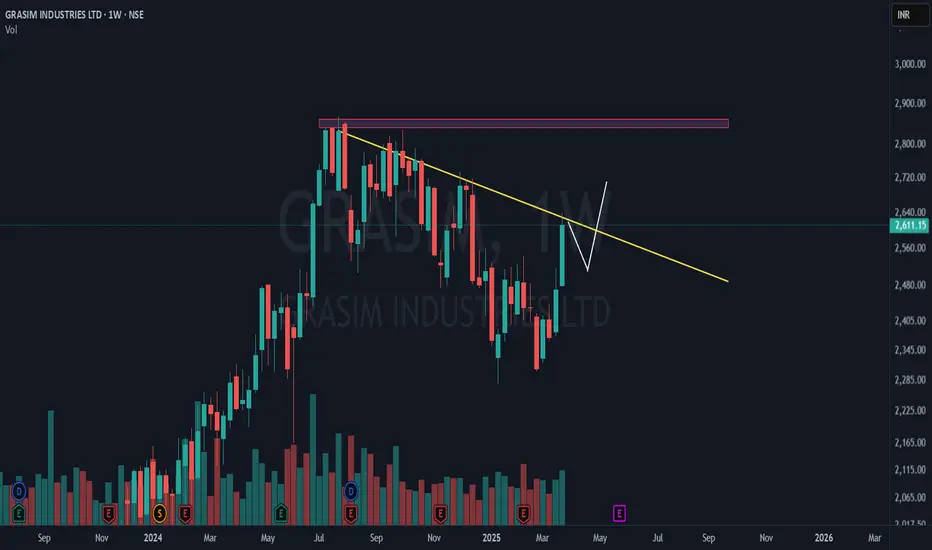
📌 yellow counter trendline (ct) – A key resistance trendline on the weekly timeframe (wtf), which the stock is currently holding at. A breakout is pending .
📌 double bottom breakout – The stock has already rallied significantly after breaking out from a double bottom pattern. However, it's now in a crucial consolidation phase, needing a halt .
📌 price action roadmap – The current structure suggests either a consolidation or a minor dip, followed by a potential breakout above the yellow ct.
📌 red supply zone = major resistance – This area marks both the weekly timeframe all-time high (wtf ath) and multi-timeframe (mtf) resistance, making it a critical level to watch.
A clean breakout from here could be an "ice-break" move! 🚀 Will it break and fly or face rejection? 🤔
🎯 Master My Self-Made Trading Strategy
📈 Telegram (Learn Today): t.me/hashtaghammer
✅ WhatsApp (Learn Today): wa.me/919455664601
📈 Telegram (Learn Today): t.me/hashtaghammer
✅ WhatsApp (Learn Today): wa.me/919455664601
Related publications
Disclaimer
The information and publications are not meant to be, and do not constitute, financial, investment, trading, or other types of advice or recommendations supplied or endorsed by TradingView. Read more in the Terms of Use.