________________________________________
💹 Garden Reach Shipbuilders & Engineers Ltd (NSE: GRSE)
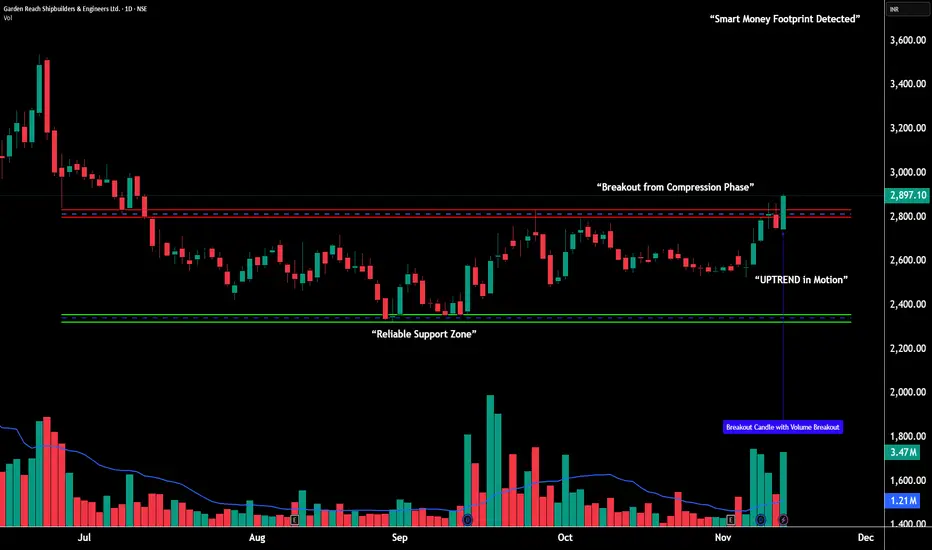
Sector: Defence & Engineering | CMP: 2,897.10
View: Bullish Momentum Breakout with Institutional Strength
________________________________________
📊 Price Action (Explained Simply):
GRSE has shifted from a slow sideways phase into a strong uptrend after rising from the 2,323 swing low to 2,904 with two powerful, wide-range green candles.
The most important part of this move is the huge jump in volume — 3.47M shares traded vs 1.21M average — which clearly signals institutional accumulation.
This breakout shows that the stock has moved from “quiet preparation” into “active momentum,” and holding above the 2,790–2,820 zone will be crucial for the continuation of this trend.
________________________________________
📉 Chart Pattern – Continuation Breakout:
After multiple accumulation attempts between 2,500–2,650, GRSE broke out with a clean, strong bullish marubozu candle.
This candle confirms buyer dominance throughout the session and typically marks the start of a new trending leg.
The structure now supports sustained follow-through as long as the stock maintains support above key zones.
________________________________________
📈 STWP Trading Analysis:
Bullish Breakout Zone: 2,897.10 - 2,904.40
Stop Loss: 2,735
The stock is now trading above short- and mid-term EMAs with trend alignment visible across daily, weekly, and monthly charts.
Sustaining above 2,790–2,820 keeps the bullish structure intact, while a strong close above 3,100 can trigger the next momentum wave.
________________________________________
🕯️ Candlestick Structure – Bullish Engulfing + Bullish Marubozu:
The current breakout session displays a Bullish Engulfing candle followed by a strong Bullish Marubozu, showing complete dominance from buyers. The engulfing pattern absorbed the previous red candle entirely, signaling a clear shift in control, while the marubozu confirms uninterrupted buying pressure throughout the session. When these two patterns appear together — backed by a sharp surge in volume — it reflects institutional accumulation and high conviction demand entering the stock. Such powerful candlestick combinations near breakout zones often act as trend-continuation triggers, indicating that buyers are firmly in charge and gearing up for the next upward expansion.
________________________________________
📏 Fibonacci Analysis:
Using swing low 2,323 → swing high 3,538:
38.2%: 2,787 → Strong support
50%: 2,930 → Active consolidation zone
61.8%: 3,047 → First major resistance
78.6%: 3,278 → Extended resistance
As long as the stock holds above 2,790–2,820, the Fibonacci map supports continuation toward higher levels.
________________________________________
🧭 Support & Resistance (STWP Levels):
Resistances: 2,955 | 3,010 | 3,116
Supports: 2,791 | 2,685 | 2,628
The zone around 2,790–2,820 is now the primary demand base and acts as the key level to protect for bullish continuation.
________________________________________
📊 Volume & Technical Setup:
Volume: 3.47M vs 1.21M → Clear institutional activity
RSI: 69 → Strong but healthy momentum
Stochastic: 98 → Buyer dominance
CCI: 205 → Strong trend confirmation
MACD: Bullish → Trend aligned across timeframes
Trend Direction: UPTREND
Volume Confirmation: Strong institutional participation
________________________________________
🧩 STWP Summary View:
Momentum: Strong
Trend: Bullish
Risk: Moderate
Volume: High
GRSE has entered a clean breakout phase supported by strong volume, supportive sector sentiment, and consistent institutional footprints.
As long as the stock protects the 2,790–2,820 zone, the path remains open toward 3,075 → 3,275 and, in a strong extension, toward 3,538.
________________________________________
⚠️ Disclosure & Disclaimer – Please Read Carefully
This analysis is for educational purposes only and should not be treated as investment advice or a buy/sell recommendation.
I am not a SEBI-registered investment adviser. All insights are based on price action, technical structure, and publicly available data.
Trading involves risk — always manage position size, stop-loss, and discipline.
Please consult a SEBI-registered financial advisor before trading based on any analysis.
________________________________________
Position Status: No active position in (GRSE) at the time of posting.
Data Source: TradingView & NSE India
________________________________________
💬 Found this useful?
🔼 Boost this post to help more learners discover structured analysis.
💭 Share your thoughts — can GRSE carry this momentum above 3,100?
🔁 Share with traders tracking defence-sector strength.
👉 Follow for more clean, price-action based institutional setups.
🚀 Stay Calm. Stay Clean. Trade With Patience.
Trade Smart | Learn Zones | Be Self-Reliant 📊
________________________________________
💹 Garden Reach Shipbuilders & Engineers Ltd (NSE: GRSE)
Sector: Defence & Engineering | CMP: 2,897.10
View: Bullish Momentum Breakout with Institutional Strength
________________________________________
📊 Price Action (Explained Simply):
GRSE has shifted from a slow sideways phase into a strong uptrend after rising from the 2,323 swing low to 2,904 with two powerful, wide-range green candles.
The most important part of this move is the huge jump in volume — 3.47M shares traded vs 1.21M average — which clearly signals institutional accumulation.
This breakout shows that the stock has moved from “quiet preparation” into “active momentum,” and holding above the 2,790–2,820 zone will be crucial for the continuation of this trend.
________________________________________
📉 Chart Pattern – Continuation Breakout:
After multiple accumulation attempts between 2,500–2,650, GRSE broke out with a clean, strong bullish marubozu candle.
This candle confirms buyer dominance throughout the session and typically marks the start of a new trending leg.
The structure now supports sustained follow-through as long as the stock maintains support above key zones.
________________________________________
📈 STWP Trading Analysis:
Bullish Breakout Zone: 2,897.10 - 2,904.40
Stop Loss: 2,735
The stock is now trading above short- and mid-term EMAs with trend alignment visible across daily, weekly, and monthly charts.
Sustaining above 2,790–2,820 keeps the bullish structure intact, while a strong close above 3,100 can trigger the next momentum wave.
________________________________________
🕯️ Candlestick Structure – Bullish Engulfing + Bullish Marubozu:
The current breakout session displays a Bullish Engulfing candle followed by a strong Bullish Marubozu, showing complete dominance from buyers. The engulfing pattern absorbed the previous red candle entirely, signaling a clear shift in control, while the marubozu confirms uninterrupted buying pressure throughout the session. When these two patterns appear together — backed by a sharp surge in volume — it reflects institutional accumulation and high conviction demand entering the stock. Such powerful candlestick combinations near breakout zones often act as trend-continuation triggers, indicating that buyers are firmly in charge and gearing up for the next upward expansion.
________________________________________
📏 Fibonacci Analysis:
Using swing low 2,323 → swing high 3,538:
38.2%: 2,787 → Strong support
50%: 2,930 → Active consolidation zone
61.8%: 3,047 → First major resistance
78.6%: 3,278 → Extended resistance
As long as the stock holds above 2,790–2,820, the Fibonacci map supports continuation toward higher levels.
________________________________________
🧭 Support & Resistance (STWP Levels):
Resistances: 2,955 | 3,010 | 3,116
Supports: 2,791 | 2,685 | 2,628
The zone around 2,790–2,820 is now the primary demand base and acts as the key level to protect for bullish continuation.
________________________________________
📊 Volume & Technical Setup:
Volume: 3.47M vs 1.21M → Clear institutional activity
RSI: 69 → Strong but healthy momentum
Stochastic: 98 → Buyer dominance
CCI: 205 → Strong trend confirmation
MACD: Bullish → Trend aligned across timeframes
Trend Direction: UPTREND
Volume Confirmation: Strong institutional participation
________________________________________
🧩 STWP Summary View:
Momentum: Strong
Trend: Bullish
Risk: Moderate
Volume: High
GRSE has entered a clean breakout phase supported by strong volume, supportive sector sentiment, and consistent institutional footprints.
As long as the stock protects the 2,790–2,820 zone, the path remains open toward 3,075 → 3,275 and, in a strong extension, toward 3,538.
________________________________________
⚠️ Disclosure & Disclaimer – Please Read Carefully
This analysis is for educational purposes only and should not be treated as investment advice or a buy/sell recommendation.
I am not a SEBI-registered investment adviser. All insights are based on price action, technical structure, and publicly available data.
Trading involves risk — always manage position size, stop-loss, and discipline.
Please consult a SEBI-registered financial advisor before trading based on any analysis.
________________________________________
Position Status: No active position in (GRSE) at the time of posting.
Data Source: TradingView & NSE India
________________________________________
💬 Found this useful?
🔼 Boost this post to help more learners discover structured analysis.
💭 Share your thoughts — can GRSE carry this momentum above 3,100?
🔁 Share with traders tracking defence-sector strength.
👉 Follow for more clean, price-action based institutional setups.
🚀 Stay Calm. Stay Clean. Trade With Patience.
Trade Smart | Learn Zones | Be Self-Reliant 📊
________________________________________
STWP | Mentor & Demand-Supply Specialist | Empowering traders through structured learning |
simpletradewithpatience.com
Community: chat.whatsapp.com/BEYz0tkqP0fJPBCWf59uel
wa.me/message/6IOPHGOXMGZ4N1
Educational Only
simpletradewithpatience.com
Community: chat.whatsapp.com/BEYz0tkqP0fJPBCWf59uel
wa.me/message/6IOPHGOXMGZ4N1
Educational Only
Disclaimer
The information and publications are not meant to be, and do not constitute, financial, investment, trading, or other types of advice or recommendations supplied or endorsed by TradingView. Read more in the Terms of Use.