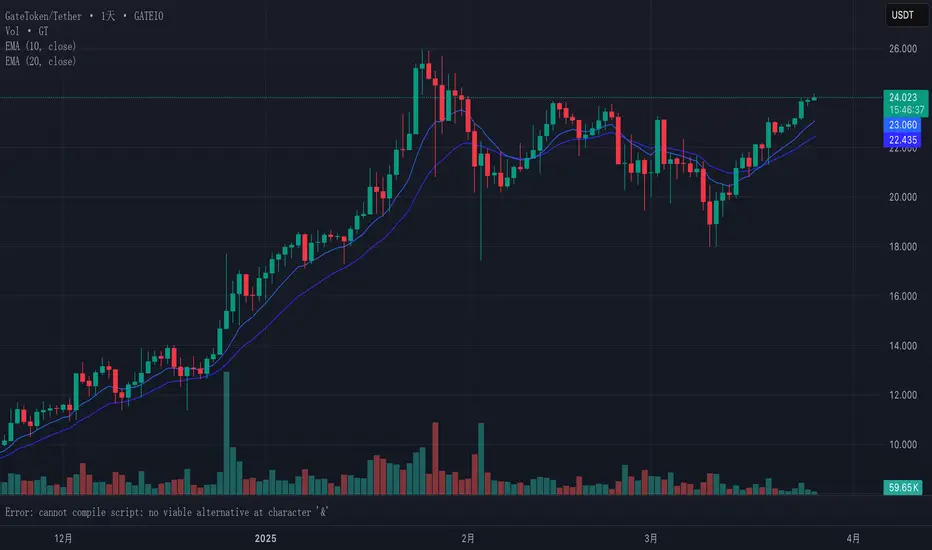
Since the significant dip in mid-March (below 19 USDT), GT has consistently formed higher lows – first around 20 USDT, then above 21 USDT, and recently maintaining levels above the EMAs. This pattern of ascending lows is a strong technical indicator of an underlying bullish sentiment, showing that buyers are becoming more aggressive at progressively higher prices, supporting the case for continued appreciation.
Disclaimer
The information and publications are not meant to be, and do not constitute, financial, investment, trading, or other types of advice or recommendations supplied or endorsed by TradingView. Read more in the Terms of Use.
Disclaimer
The information and publications are not meant to be, and do not constitute, financial, investment, trading, or other types of advice or recommendations supplied or endorsed by TradingView. Read more in the Terms of Use.