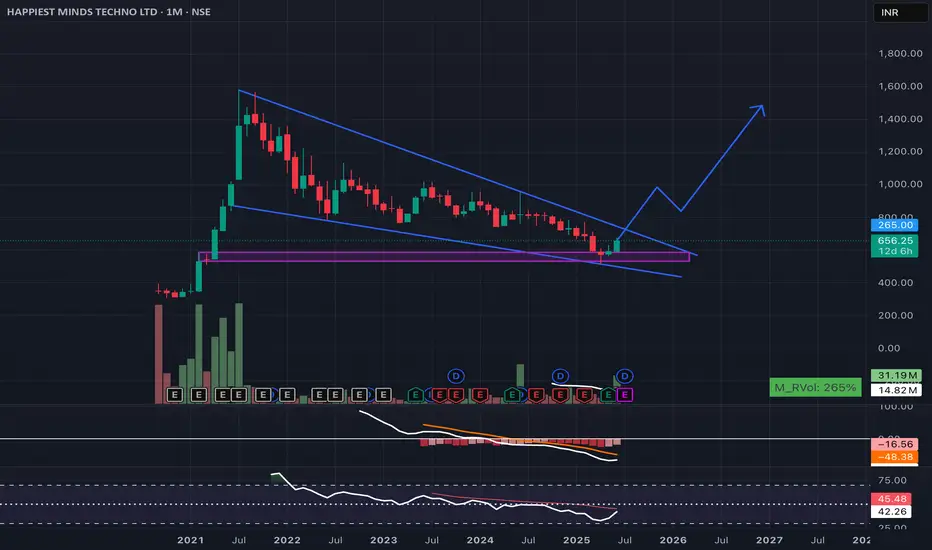
📈 HAPPIEST MINDS – Falling Wedge Breakout on Monthly Chart
Date: June 18, 2025 | Exchange: NSE | Timeframe: Monthly
Happiest Minds is showing signs of a potential long-term trend reversal. Price is breaking out of a falling wedge pattern after a multi-month downtrend, with strong bullish momentum this month (+10.47%).
Key Points:
* Pattern: Falling wedge breakout
* Volume: Spike with 265% RVOL – early accumulation
* MACD: Bearish momentum fading
* RSI: Bouncing from oversold zone
View: Long-term bullish reversal in play. Sustained close above trendline could trigger a fresh uptrend toward 1200–1500 levels in the coming quarters.
Disclaimer
The information and publications are not meant to be, and do not constitute, financial, investment, trading, or other types of advice or recommendations supplied or endorsed by TradingView. Read more in the Terms of Use.
Disclaimer
The information and publications are not meant to be, and do not constitute, financial, investment, trading, or other types of advice or recommendations supplied or endorsed by TradingView. Read more in the Terms of Use.