Havells CMP 1460
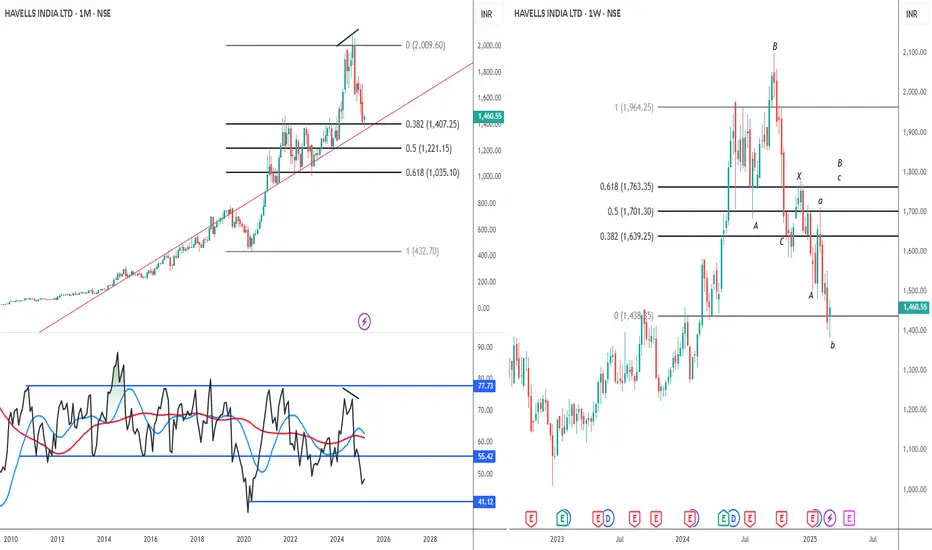
Trendline- the long term trendline is intact. But this is not the only tool used to gauge the trend. Yes it is still in the safe zone.
Fib - the support at 38.2% is strength. But will it hold ??
RSI - mind u this is a monthly chart and we have a strong negative divergence. Which is a sign of reversal
Elliott- The stock is exhibiting a complex corrective pattern. Which means the correction is not over. This rally should go to 1760, since in the real world nothing is perfect we will take 1700 as our tgt.
Conclusion - this is c of B. Hence expect a sharp rally from here. But do not forget to exit.
Disclaimer
The information and publications are not meant to be, and do not constitute, financial, investment, trading, or other types of advice or recommendations supplied or endorsed by TradingView. Read more in the Terms of Use.
Disclaimer
The information and publications are not meant to be, and do not constitute, financial, investment, trading, or other types of advice or recommendations supplied or endorsed by TradingView. Read more in the Terms of Use.