1. RSI Weak Divergence
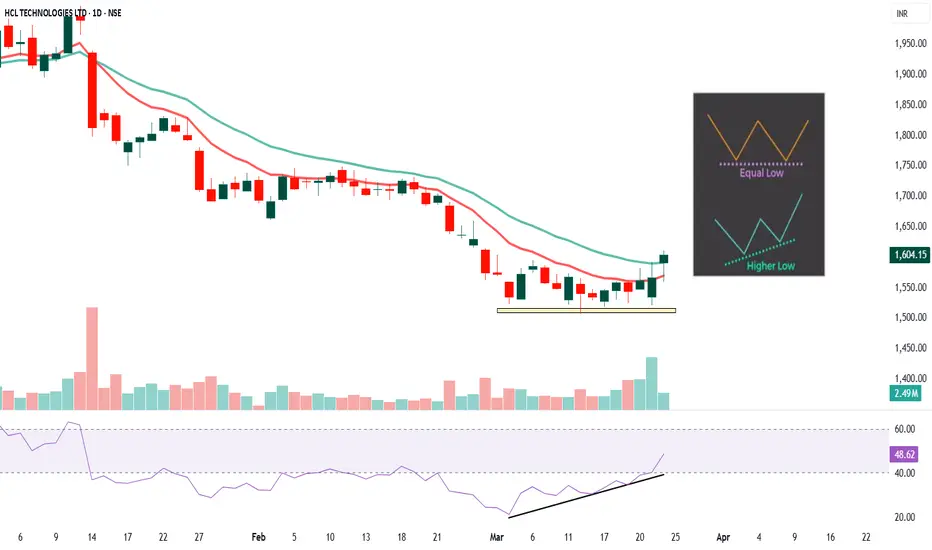
The RSI (Relative Strength Index) is showing a higher low while the price has formed an equal low on the chart.
This is a sign of weak bullish divergence — the RSI is improving despite the price showing no significant upward movement.
Weak divergence often indicates that buying pressure is gradually increasing but is not yet strong enough for a full trend reversal.
RSI value is currently 48.62, which is in the neutral zone (between 40 and 60), suggesting moderate momentum.
2. Candle Pattern
A double bottom formation is visible on the chart (highlighted by the yellow zone).
The candles near the double bottom are forming higher lows, suggesting that sellers are losing strength.
Recent green candles with increasing volume confirm buyer interest at the support level.
3. EMA Analysis
10 EMA (red) < 20 EMA (green) ➔ Still bearish trend but flattening, indicating potential trend reversal.
Price has recently closed above the 10 EMA, showing an early signal of bullish momentum.
For a confirmed trend reversal, the price needs to sustain above both the 10 EMA and 20 EMA with increasing volume.
✅ Potential Strategy
📌 Entry:
Ideal entry after a confirmed close above the 20 EMA (~₹1,620–1,630).
Alternatively, wait for a pullback to the 10 EMA with a bullish confirmation candle.
🎯 Targets:
First target = ₹1,650 (recent swing high).
Second target = ₹1,700 (psychological resistance).
🚨 Stop Loss:
Place stop loss below the double bottom support (~₹1,540).
🔁 Exit:
Trail stop-loss using the 10 EMA once the price moves favorably.
Exit if the price closes below the 10 EMA with high volume.
⚠️ Educational Disclaimer
This analysis is for educational purposes only and does not constitute financial advice. Trading involves substantial risk, and past performance is not indicative of future results. Please conduct your own research and consult with a financial advisor before making any trading decisions.
Disclaimer
The information and publications are not meant to be, and do not constitute, financial, investment, trading, or other types of advice or recommendations supplied or endorsed by TradingView. Read more in the Terms of Use.
Disclaimer
The information and publications are not meant to be, and do not constitute, financial, investment, trading, or other types of advice or recommendations supplied or endorsed by TradingView. Read more in the Terms of Use.