CMP: 985
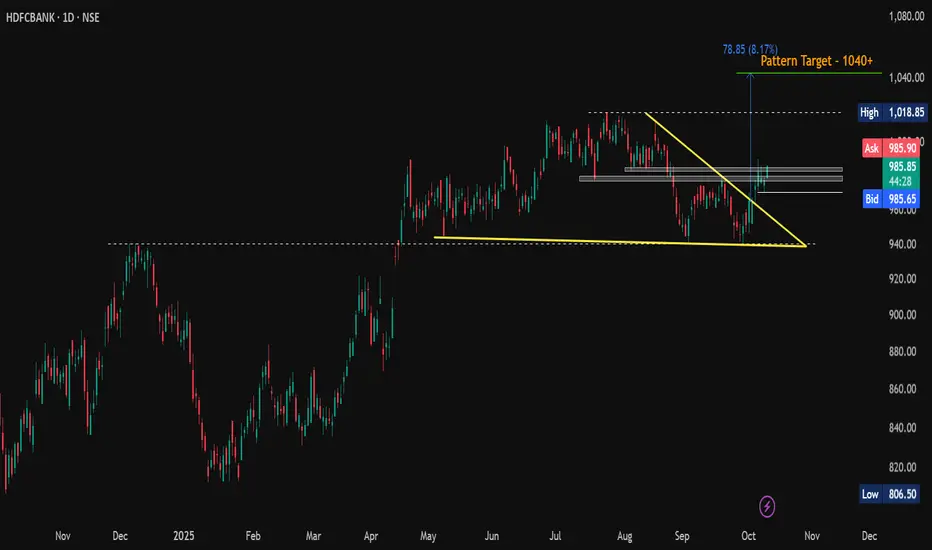
HDFCBANK has broken out of a falling wedge on the daily chart - a classic bullish reversal setup!
🔹 Chart Pattern: Falling Wedge Breakout
🔹 Breakout Confirmation: Price has decisively broken above the upper trendline
🔹 Retest Zone: Price is consolidating near the breakout zone (977 – 980), showing strength
🔹 Pattern Target: 1040+
🔹 Immediate Resistance: 985
🔹 Support Zones: 977 & 970
📈 A Daily Close Above 985 (DCB) can fuel momentum towards the wedge breakout target of 1040+.
#HDFCBANK | #BreakoutStocks | #FallingWedge | #ChartPatterns | #TechnicalAnalysis | #SwingTrading | #BullishBreakout
📌 Disclaimer: This analysis is shared for educational purposes only. It is not a buy/sell recommendation. Please do your own research before making any trading decisions.
Disclaimer
The information and publications are not meant to be, and do not constitute, financial, investment, trading, or other types of advice or recommendations supplied or endorsed by TradingView. Read more in the Terms of Use.
Disclaimer
The information and publications are not meant to be, and do not constitute, financial, investment, trading, or other types of advice or recommendations supplied or endorsed by TradingView. Read more in the Terms of Use.