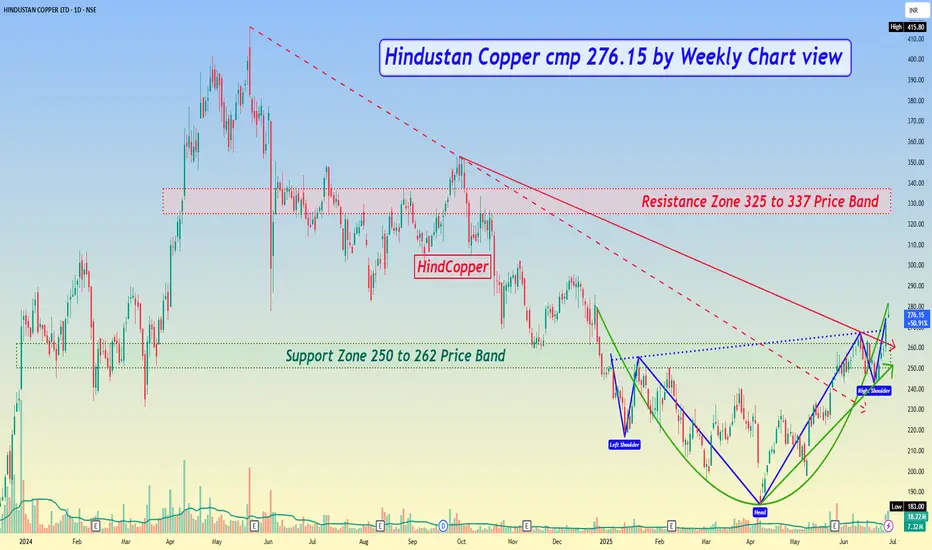
*Hindustan Copper cmp 276.15 by Weekly Chart view*
- Support Zone 250 to 262 Price Band
- Resistance Zone 325 to 337 Price Band
- All major Technical indicators BB, EMA, MACD, RSI trending positively
- Stock is seen trending with positive momentum on Daily and Weekly Charts
- Rising Support Trendline respected with Falling Resistance Trendline Breakout
- Bullish Head & Shoulders pattern within Bullish Rounding Bottom seen completed
- Volumes are getting attractive and spiking heavily above the average traded quantity
- Stock seems to have tested and retested the Support Zone and attempting upwards momentum
Disclaimer
The information and publications are not meant to be, and do not constitute, financial, investment, trading, or other types of advice or recommendations supplied or endorsed by TradingView. Read more in the Terms of Use.
Disclaimer
The information and publications are not meant to be, and do not constitute, financial, investment, trading, or other types of advice or recommendations supplied or endorsed by TradingView. Read more in the Terms of Use.