The stock has successfully completed a multi-decade base breakout and is now challenging its final long-term resistance. The momentum is bullish, but a new ATH will require a confirmed break of the 2010 trendline.
📈 1. The Long-Term Context (The "Big Picture")
- Parabolic Uptrend: After hitting its all-time low in March 2020, the stock has been in a massive bullish uptrend, surging over 2,170% from its bottom.
- Brief Correction: This major move was followed by a healthy, brief downtrend/consolidation that found its low in May 2025, allowing the chart to reset for its next move.
- Recent Rising Volume: Critically, trading volume has been rising significantly in recent months, confirming strong investor interest in this new trend.
🚀 2. The Current Breakout (The Decisive Move)
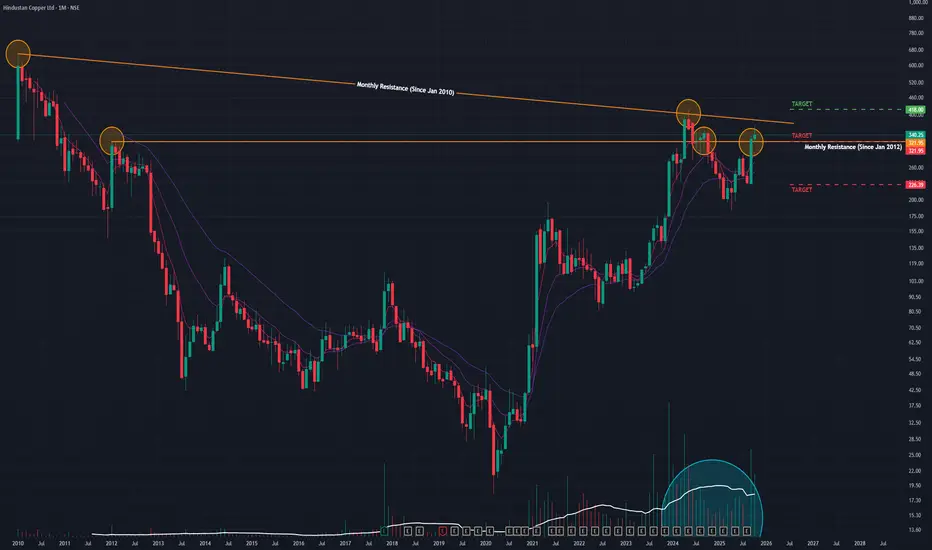
The stock is currently navigating two of the most significant resistance levels on its multi-decade chart:
1. Jan 2012 Horizontal Resistance: A major structural level that capped all rallies for over 12 years.
2. Jan 2010 Angular Resistance: A long-term downtrend line that forms the final barrier to a new price discovery phase.
In September and October, the stock achieved a major milestone: it broke out and closed above the 12-year horizontal resistance line.
During October, the stock successfully retested this old resistance as new support. While it finished the month with a 3.28% gain on exceptionally high volume, it also formed an "inverted hammer" candle. This candle at a new support level is a sign of a "battle," where sellers tried to push the price down but buyers ultimately stepped in, defending the breakout.
📊 3. Key Technical Indicators
The underlying momentum on higher timeframes supports a bullish resolution:
- RSI: The Relative Strength Index is rising on the Monthly chart, indicating strong, sustained buying momentum.
- EMAs: The short-term Exponential Moving Averages are in a "PCO" (Price Crossover) state on the Monthly timeframe, confirming the long-term trend is powerfully bullish.
🎯 4. Future Scenarios & Key Levels to Watch
The stock is currently coiled less than 15% below its final angular resistance from 2010.
🐂 The Bullish Case (Final Breakout)
- Trigger: A decisive, high-volume breakout and close above the 2010 angular resistance trendline.
- Confirmation: This would confirm the start of a new, long-term bull market and put the stock into "blue-sky" price discovery.
- Target: The next logical technical price target is projected to be ₹415, with a high probability of a move toward a new ATH.
🐻 The Bearish Case (Breakout Failure)
- Trigger: The stock fails to break the 2010 trendline and, more importantly, loses its new support (the 2012 breakout level).
- Confirmation: A high-volume close below the ₹320 support level.
- Target: This failure would signal a fake breakout and could lead to a sharp correction, retesting the next major support level at ₹225.
Conclusion
This is a high-conviction breakout setup. The successful retest of the 12-year resistance is a very bullish sign. All eyes should now be on the 2010 angular trendline. A break above it would be the final confirmation, while a failure and drop below ₹320 would invalidate the immediate bullish thesis.
📈 1. The Long-Term Context (The "Big Picture")
- Parabolic Uptrend: After hitting its all-time low in March 2020, the stock has been in a massive bullish uptrend, surging over 2,170% from its bottom.
- Brief Correction: This major move was followed by a healthy, brief downtrend/consolidation that found its low in May 2025, allowing the chart to reset for its next move.
- Recent Rising Volume: Critically, trading volume has been rising significantly in recent months, confirming strong investor interest in this new trend.
🚀 2. The Current Breakout (The Decisive Move)
The stock is currently navigating two of the most significant resistance levels on its multi-decade chart:
1. Jan 2012 Horizontal Resistance: A major structural level that capped all rallies for over 12 years.
2. Jan 2010 Angular Resistance: A long-term downtrend line that forms the final barrier to a new price discovery phase.
In September and October, the stock achieved a major milestone: it broke out and closed above the 12-year horizontal resistance line.
During October, the stock successfully retested this old resistance as new support. While it finished the month with a 3.28% gain on exceptionally high volume, it also formed an "inverted hammer" candle. This candle at a new support level is a sign of a "battle," where sellers tried to push the price down but buyers ultimately stepped in, defending the breakout.
📊 3. Key Technical Indicators
The underlying momentum on higher timeframes supports a bullish resolution:
- RSI: The Relative Strength Index is rising on the Monthly chart, indicating strong, sustained buying momentum.
- EMAs: The short-term Exponential Moving Averages are in a "PCO" (Price Crossover) state on the Monthly timeframe, confirming the long-term trend is powerfully bullish.
🎯 4. Future Scenarios & Key Levels to Watch
The stock is currently coiled less than 15% below its final angular resistance from 2010.
🐂 The Bullish Case (Final Breakout)
- Trigger: A decisive, high-volume breakout and close above the 2010 angular resistance trendline.
- Confirmation: This would confirm the start of a new, long-term bull market and put the stock into "blue-sky" price discovery.
- Target: The next logical technical price target is projected to be ₹415, with a high probability of a move toward a new ATH.
🐻 The Bearish Case (Breakout Failure)
- Trigger: The stock fails to break the 2010 trendline and, more importantly, loses its new support (the 2012 breakout level).
- Confirmation: A high-volume close below the ₹320 support level.
- Target: This failure would signal a fake breakout and could lead to a sharp correction, retesting the next major support level at ₹225.
Conclusion
This is a high-conviction breakout setup. The successful retest of the 12-year resistance is a very bullish sign. All eyes should now be on the 2010 angular trendline. A break above it would be the final confirmation, while a failure and drop below ₹320 would invalidate the immediate bullish thesis.
Disclaimer: This analysis is my personal view & for educational purposes only. They shall not be construed as trade or investment advice. Before making any financial decision, it is imperative that you consult with a qualified financial professional.
Disclaimer
The information and publications are not meant to be, and do not constitute, financial, investment, trading, or other types of advice or recommendations supplied or endorsed by TradingView. Read more in the Terms of Use.