📊 Intraday Support & Resistance Levels
Immediate Support: ₹442.00 – A level where buyers have previously shown interest.
Immediate Resistance: ₹455.90 – A recent high that may act as a barrier to upward movement.
Additional Resistance Levels:
₹461.80
₹470.70
₹479.60
₹494.00
Additional Support Levels:
₹427.50
₹436.40
🔍 Technical Indicators
Relative Strength Index (RSI): Approximately 41.05, indicating a neutral to bearish momentum.
Moving Average Convergence Divergence (MACD): At -1.680, suggesting a bearish trend.
Average Directional Index (ADX): Around 21.33, indicating a weak trend strength.
Stochastic Oscillator: Approximately 63.96, pointing to neutral momentum.
⚠️ Trade Considerations
Bullish Scenario: If the price sustains above ₹442.00, there may be potential for a rebound towards ₹455.90.
Bearish Scenario: A drop below ₹442.00 could lead to further declines, possibly testing lower support levels.
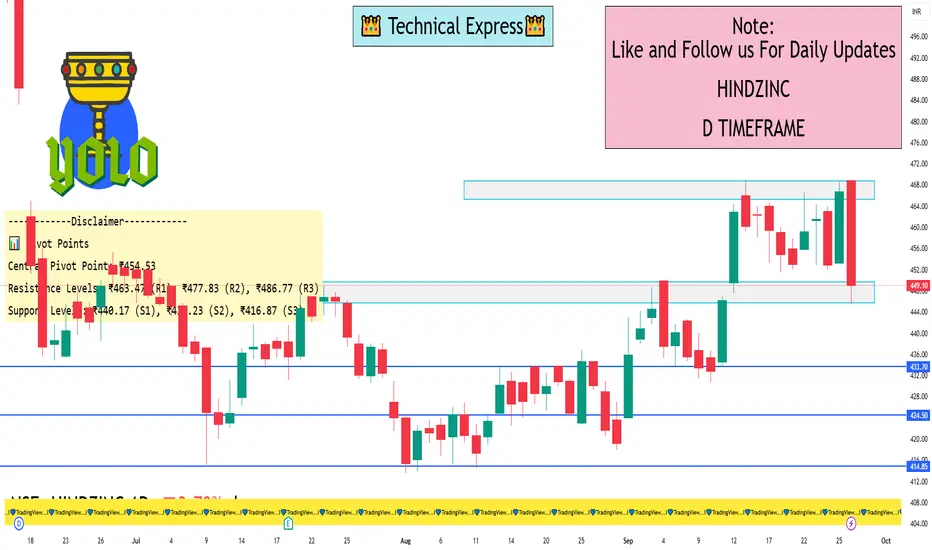
📊 Pivot Points
Central Pivot Point: ₹454.53
Resistance Levels: ₹463.47 (R1), ₹477.83 (R2), ₹486.77 (R3)
Support Levels: ₹440.17 (S1), ₹431.23 (S2), ₹416.87 (S3)
📝 Outlook
Bullish Scenario: If the price sustains above ₹442.00, there may be potential for a rebound towards ₹455.90.
Bearish Scenario: A drop below ₹442.00 could lead to further declines, possibly testing lower support levels.
Immediate Support: ₹442.00 – A level where buyers have previously shown interest.
Immediate Resistance: ₹455.90 – A recent high that may act as a barrier to upward movement.
Additional Resistance Levels:
₹461.80
₹470.70
₹479.60
₹494.00
Additional Support Levels:
₹427.50
₹436.40
🔍 Technical Indicators
Relative Strength Index (RSI): Approximately 41.05, indicating a neutral to bearish momentum.
Moving Average Convergence Divergence (MACD): At -1.680, suggesting a bearish trend.
Average Directional Index (ADX): Around 21.33, indicating a weak trend strength.
Stochastic Oscillator: Approximately 63.96, pointing to neutral momentum.
⚠️ Trade Considerations
Bullish Scenario: If the price sustains above ₹442.00, there may be potential for a rebound towards ₹455.90.
Bearish Scenario: A drop below ₹442.00 could lead to further declines, possibly testing lower support levels.
📊 Pivot Points
Central Pivot Point: ₹454.53
Resistance Levels: ₹463.47 (R1), ₹477.83 (R2), ₹486.77 (R3)
Support Levels: ₹440.17 (S1), ₹431.23 (S2), ₹416.87 (S3)
📝 Outlook
Bullish Scenario: If the price sustains above ₹442.00, there may be potential for a rebound towards ₹455.90.
Bearish Scenario: A drop below ₹442.00 could lead to further declines, possibly testing lower support levels.
I built a Buy & Sell Signal Indicator with 85% accuracy.
📈 Get access via DM or
WhatsApp: wa.link/d997q0
Contact - +91 76782 40962
| Email: techncialexpress@gmail.com
| Script Coder | Trader | Investor | From India
📈 Get access via DM or
WhatsApp: wa.link/d997q0
Contact - +91 76782 40962
| Email: techncialexpress@gmail.com
| Script Coder | Trader | Investor | From India
Related publications
Disclaimer
The information and publications are not meant to be, and do not constitute, financial, investment, trading, or other types of advice or recommendations supplied or endorsed by TradingView. Read more in the Terms of Use.