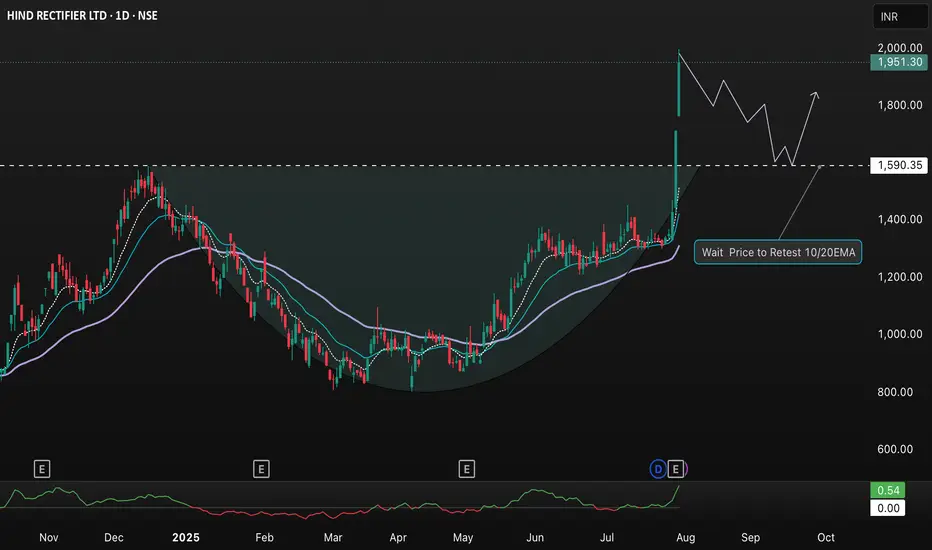
This chart for Hind Rectifiers Ltd (NSE: HIRECT) on the daily timeframe showcases a classic “Cup and Handle” breakout. After extended consolidation and base formation, price has surged above the 1,590 resistance, supported by strong volume and a rapid move to 1,951.30, reflecting a 13.96% single-day gain.
The annotation suggests waiting for a potential retest of the breakout zone (around 1,590) or the 10/20 EMA levels before considering entry. The projected path anticipates a period of consolidation or pullback, followed by a possible continuation to the upside. This setup highlights a bullish momentum with emphasis on risk management and optimal entry timing based on technical signals.
The annotation suggests waiting for a potential retest of the breakout zone (around 1,590) or the 10/20 EMA levels before considering entry. The projected path anticipates a period of consolidation or pullback, followed by a possible continuation to the upside. This setup highlights a bullish momentum with emphasis on risk management and optimal entry timing based on technical signals.
Disclaimer
The information and publications are not meant to be, and do not constitute, financial, investment, trading, or other types of advice or recommendations supplied or endorsed by TradingView. Read more in the Terms of Use.
Disclaimer
The information and publications are not meant to be, and do not constitute, financial, investment, trading, or other types of advice or recommendations supplied or endorsed by TradingView. Read more in the Terms of Use.