📊 1-Week Technical Overview
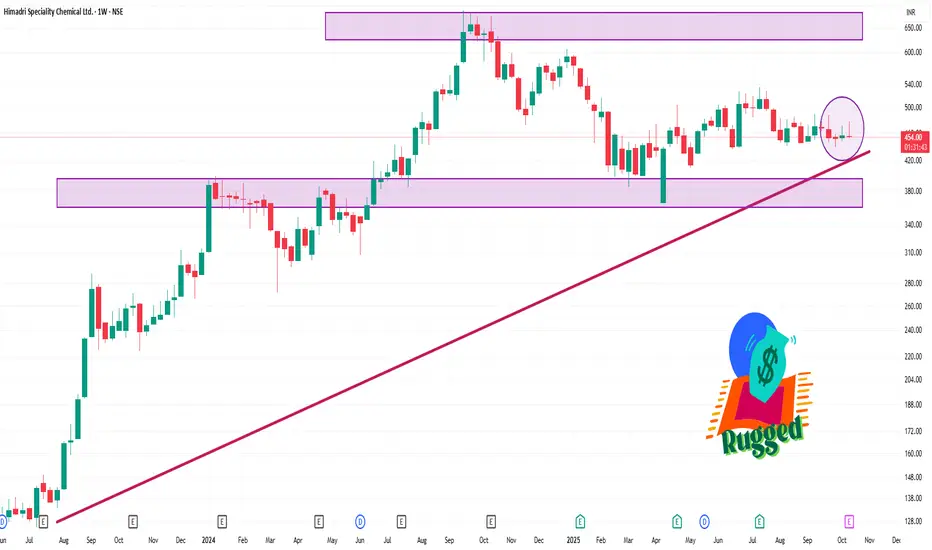
Price Change: HSCL has gained approximately 3.35% over the past week.
Day Range: ₹458.60 – ₹469.55
52-Week Range: ₹365.35 – ₹676.20
Volume: 535,912 shares traded
📈 Technical Indicators
Relative Strength Index (RSI): 36.75, suggesting a neutral to slightly oversold condition.
Moving Averages: Short-term (5-day) and medium-term (50-day) moving averages indicate a neutral to slightly bearish outlook.
MACD: The Moving Average Convergence Divergence indicator is negative, reinforcing a bearish sentiment.
Related publications
Disclaimer
The information and publications are not meant to be, and do not constitute, financial, investment, trading, or other types of advice or recommendations supplied or endorsed by TradingView. Read more in the Terms of Use.
Related publications
Disclaimer
The information and publications are not meant to be, and do not constitute, financial, investment, trading, or other types of advice or recommendations supplied or endorsed by TradingView. Read more in the Terms of Use.