Long
Projeção ALTISTA do IBOV no gráfico Semanal
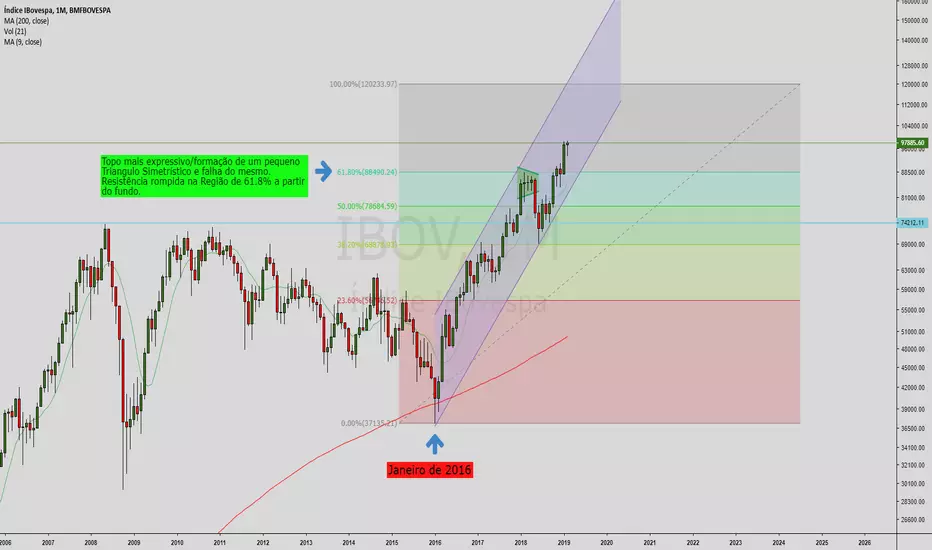
Topo mais expressivo/formação de um pequeno Triangulo Simetrístico e falha do mesmo. Resistência rompida na Região de 61.8% a partir do fundo.
Não vejo motivos para não acreditar na continuidade do movimento alcançando a faixa dos 120.000 pontos!
Não vejo motivos para não acreditar na continuidade do movimento alcançando a faixa dos 120.000 pontos!
Disclaimer
The information and publications are not meant to be, and do not constitute, financial, investment, trading, or other types of advice or recommendations supplied or endorsed by TradingView. Read more in the Terms of Use.