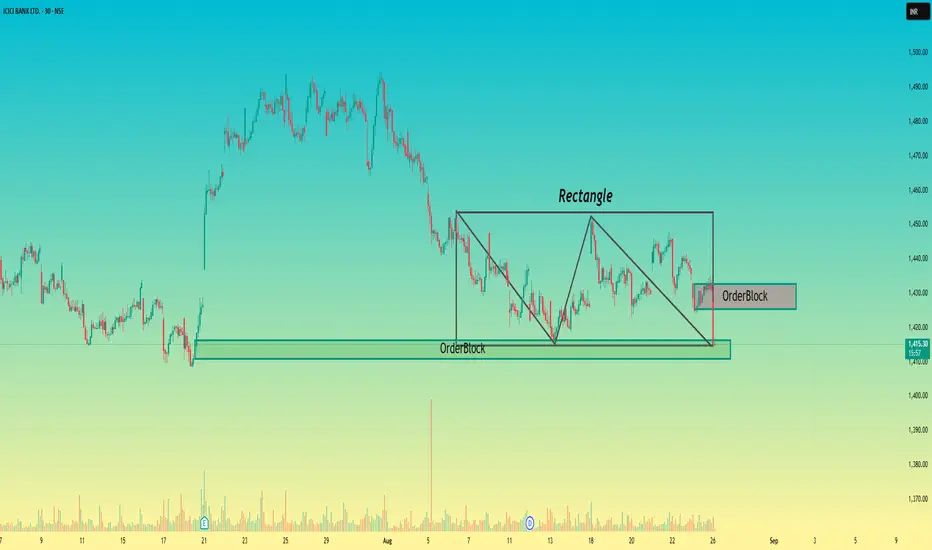
📊 ICICI Bank (30-min chart) – Rectangle + Order Blocks
🔹 Major Demand Zone (Bullish Order Block)
Strong demand around ₹1,410–₹1,415 has been respected multiple times.
This zone continues to act as a base for buyers.
🔹 Rectangle Consolidation
Price is trapped in a rectangle range of ₹1,415–₹1,450.
Consolidation shows indecision before a breakout.
🔹 Bearish Order Block at ₹1,425
A bearish order block has formed near ₹1,425, creating selling pressure on pullbacks.
This zone is currently acting as a short-term resistance.
📌 Trading Plan
As long as price stays below ₹1,425, sellers may keep control.
Breakdown below ₹1,410 can extend downside toward ₹1,390–₹1,380.
On the other hand, a clean breakout above ₹1,435 will invalidate the bearish OB and flip structure bullish.
Above ₹1,435, targets open toward ₹1,450 → ₹1,470 → ₹1,490.
⚖️ Risk-Reward Setup
Bearish bias: Short entries near ₹1,425–₹1,430 with SL above ₹1,435.
Bullish bias: Long trades only above ₹1,435, targeting ₹1,450–₹1,490.
📍 Conclusion: ICICI Bank is consolidating in a rectangle. Key levels to watch are ₹1,410 support and ₹1,425 resistance. A breakdown below ₹1,410 favors sellers, while a breakout above ₹1,435 turns the trend bullish.
Disclaimer
The information and publications are not meant to be, and do not constitute, financial, investment, trading, or other types of advice or recommendations supplied or endorsed by TradingView. Read more in the Terms of Use.
Disclaimer
The information and publications are not meant to be, and do not constitute, financial, investment, trading, or other types of advice or recommendations supplied or endorsed by TradingView. Read more in the Terms of Use.