Pattern Summary
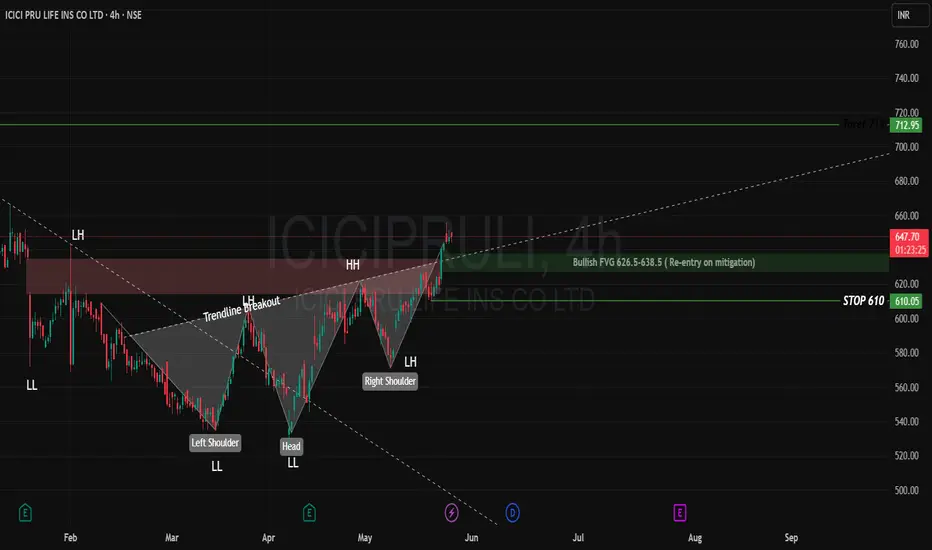
Inverse H&S Pattern
Trendline Breakout
Candlestick Insight: Inverted Hammer at CMP ₹647
Support Zones
Stop-loss Region: ₹610 (Below the neckline and structure support).
Disclaimer: lnkd.in/gJJDnvn2
Inverse H&S Pattern
- Left Shoulder: ₹535
- Head: ₹525
- Right Shoulder: ₹571
- Neckline/Breakout: ₹631 (Confirmed breakout zone)
- Target (Projected): ₹712 (Measured move aligns with pattern height)
Trendline Breakout
- Confirms bullish momentum post-H&S breakout.
- Price has cleared previous LH (Lower High) zones — trend bias shifting bullish.
Candlestick Insight: Inverted Hammer at CMP ₹647
- Appears after a rally, signals potential short-term exhaustion or pullback.
- Not a reversal on its own, but if followed by a red candle, can suggest short-term retracement.
- Occurs near resistance (~₹650) — caution for overbought levels in short term.
Support Zones
- Bullish Fair Value Gap (FVG): ₹626.5 – ₹638.5
- Re-entry opportunity upon mitigation (price retracing to fill the gap).
- Well-aligned with neckline retest (₹631) — a textbook retest-and-go scenario.
Stop-loss Region: ₹610 (Below the neckline and structure support).
Disclaimer: lnkd.in/gJJDnvn2
Disclaimer
The information and publications are not meant to be, and do not constitute, financial, investment, trading, or other types of advice or recommendations supplied or endorsed by TradingView. Read more in the Terms of Use.
Disclaimer
The information and publications are not meant to be, and do not constitute, financial, investment, trading, or other types of advice or recommendations supplied or endorsed by TradingView. Read more in the Terms of Use.