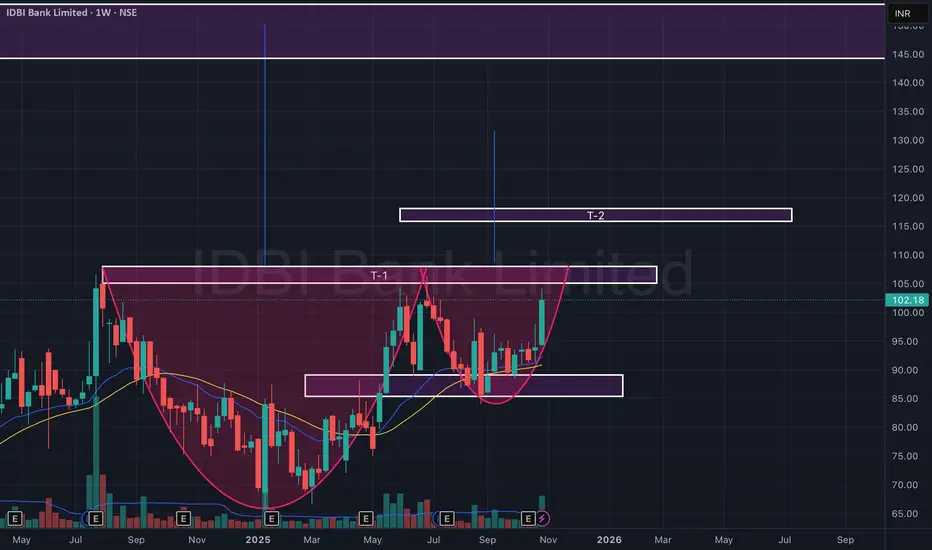
IDBI Bank on the weekly timeframe is showing a strong Cup & Handle formation, indicating a potential medium-term trend reversal. The stock has been consolidating since mid-2024, forming a rounded cup base near ₹72–75, suggesting steady accumulation. It later created a handle retracement around ₹85–88, which acted as a healthy correction before the current breakout.
The price has now moved above the neckline resistance near ₹100–104, confirming a potential breakout supported by rising volume and a bullish EMA crossover (20 EMA crossing above 50 EMA). The momentum indicators such as RSI are trending upward and still below the overbought zone, giving room for further upside.
From a pattern perspective, the breakout above the neckline signals bullish continuation with possible targets around ₹108–110 (T-1) as the initial confirmation zone and ₹118–122 (T-2) as the measured move based on the cup depth. If the momentum sustains over the coming weeks, an extended projection towards ₹145 cannot be ruled out.
On the downside, immediate support lies at ₹88–90 (handle base) while the major support zone remains around ₹75, aligning with the previous consolidation base and 200 EMA zone.
Overall, the setup looks constructive — a decisive weekly close above ₹104 would reinforce the bullish breakout and potentially lead to a sustained move toward the upper targets.
Disclaimer
The information and publications are not meant to be, and do not constitute, financial, investment, trading, or other types of advice or recommendations supplied or endorsed by TradingView. Read more in the Terms of Use.
Disclaimer
The information and publications are not meant to be, and do not constitute, financial, investment, trading, or other types of advice or recommendations supplied or endorsed by TradingView. Read more in the Terms of Use.