Energy Exhausted: Indian Energy Exchange Nears Breakdown
Greetings Fellow Traders, Sharing a critical technical update on Indian Energy Exchange (IEX). The chart is flashing early warning signs of a potential breakdown. Key zones and price action indicate growing bearish momentum stay alert and trade with caution!
Indian Energy Exchange – Bearish Outlook Strengthens.
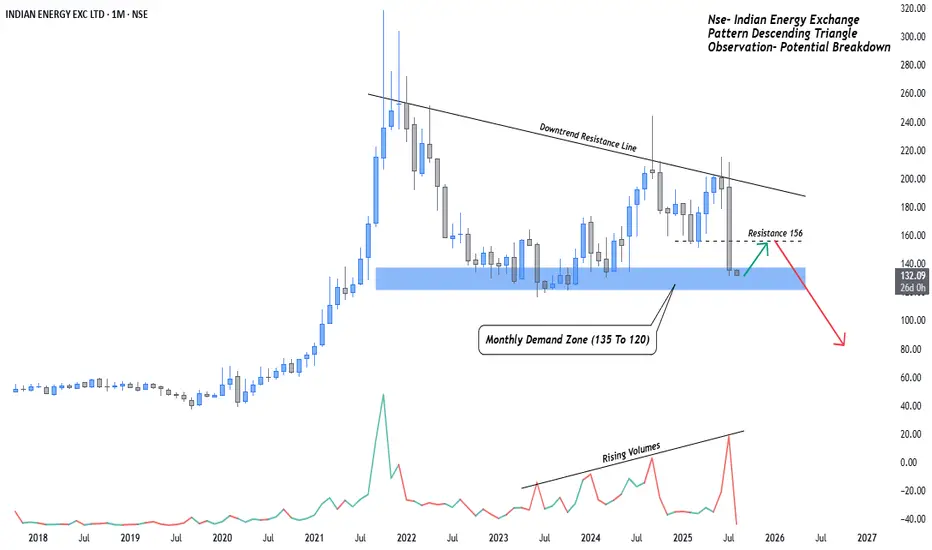
Indian Energy Exchange is showing clear signs of weakness as it continues to respect a long standing downtrend resistance line. The recent price action saw a sharp rejection near the 156 resistance, reinforcing bearish control.
Currently, the stock is testing a crucial Monthly Demand Zone (135–120) a level that has historically offered strong support. However, the structure now suggests increasing vulnerability.
Bearish Signals-:
Price consistently forming lower highs beneath the descending trendline.
Rising volume on red candles signals strengthening selling pressure.
Price nearing the lower boundary of demand, risking a breakdown.
Key Levels to Watch:
Breakdown below 120-: A close below this level, especially with volume confirmation, could trigger a deeper correction toward 70 or lower.
Rejection from 156 zone-: Any bounce back to this level may offer fresh shorting opportunities, unless a trend reversal is confirmed.
A decisive move below 120 would mark the beginning of a markdown phase, validating the broader bearish reversal pattern in play.
This publication I am sharing for learning purpose like price action, Support and resistance and trends ETC.
Regards- Amit
Indian Energy Exchange – Bearish Outlook Strengthens.
Indian Energy Exchange is showing clear signs of weakness as it continues to respect a long standing downtrend resistance line. The recent price action saw a sharp rejection near the 156 resistance, reinforcing bearish control.
Currently, the stock is testing a crucial Monthly Demand Zone (135–120) a level that has historically offered strong support. However, the structure now suggests increasing vulnerability.
Bearish Signals-:
Price consistently forming lower highs beneath the descending trendline.
Rising volume on red candles signals strengthening selling pressure.
Price nearing the lower boundary of demand, risking a breakdown.
Key Levels to Watch:
Breakdown below 120-: A close below this level, especially with volume confirmation, could trigger a deeper correction toward 70 or lower.
Rejection from 156 zone-: Any bounce back to this level may offer fresh shorting opportunities, unless a trend reversal is confirmed.
A decisive move below 120 would mark the beginning of a markdown phase, validating the broader bearish reversal pattern in play.
This publication I am sharing for learning purpose like price action, Support and resistance and trends ETC.
Regards- Amit
Disclaimer
The information and publications are not meant to be, and do not constitute, financial, investment, trading, or other types of advice or recommendations supplied or endorsed by TradingView. Read more in the Terms of Use.
Disclaimer
The information and publications are not meant to be, and do not constitute, financial, investment, trading, or other types of advice or recommendations supplied or endorsed by TradingView. Read more in the Terms of Use.