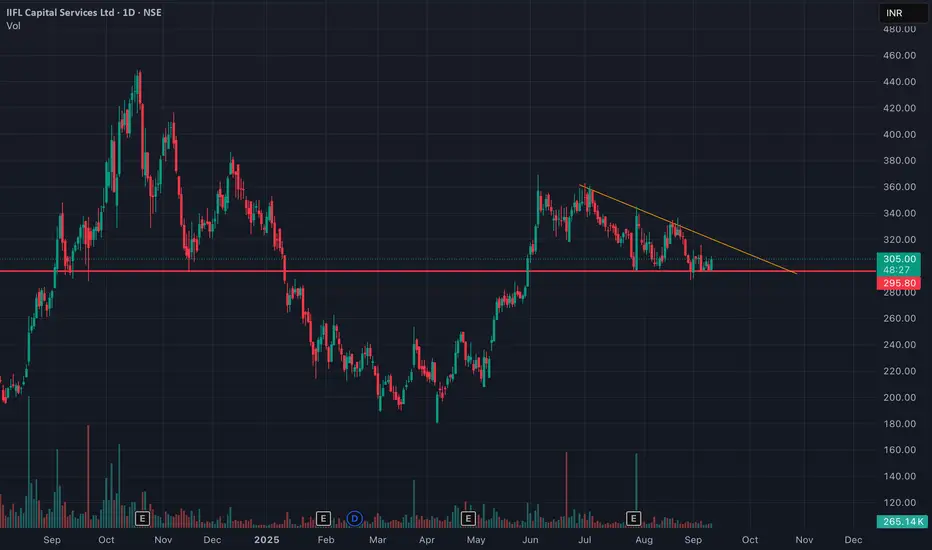
The daily chart for IIFL Capital Services Ltd. reveals a classic technical pattern descending triangle.
The price is now approaching the apex of this triangle, suggesting that a significant price move, or a breakout, is likely to occur soon. A decisive break above the descending trendline on high volume would indicate a bullish reversal, while a break below the crucial horizontal support would signal a bearish continuation of the recent downtrend.
The price is now approaching the apex of this triangle, suggesting that a significant price move, or a breakout, is likely to occur soon. A decisive break above the descending trendline on high volume would indicate a bullish reversal, while a break below the crucial horizontal support would signal a bearish continuation of the recent downtrend.
Disclaimer
The information and publications are not meant to be, and do not constitute, financial, investment, trading, or other types of advice or recommendations supplied or endorsed by TradingView. Read more in the Terms of Use.
Disclaimer
The information and publications are not meant to be, and do not constitute, financial, investment, trading, or other types of advice or recommendations supplied or endorsed by TradingView. Read more in the Terms of Use.