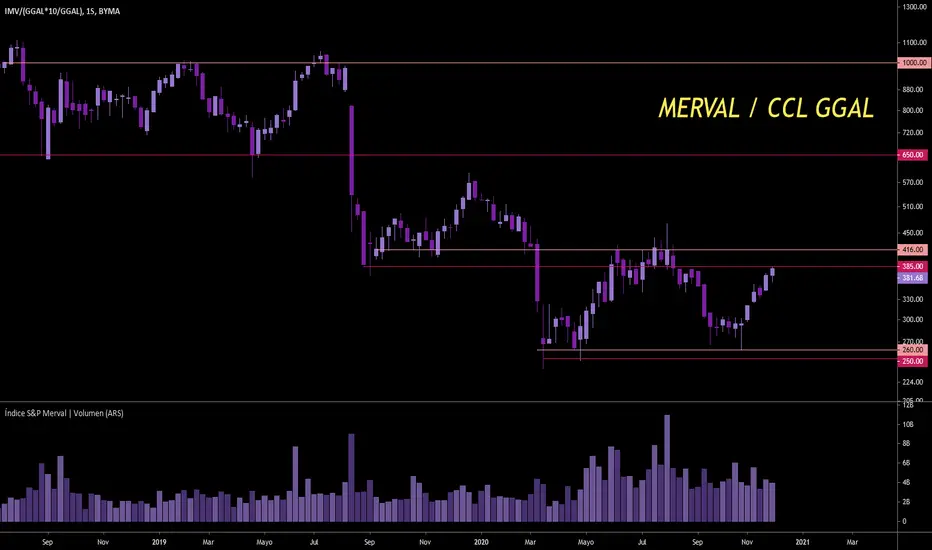
se prende a los gráficos en zona de resistencia, en este caso es de 400 +/- 15. Lo que elegí creer hace 11 semanas en 290, pasó. Ahora es ver que hace.
Disclaimer
The information and publications are not meant to be, and do not constitute, financial, investment, trading, or other types of advice or recommendations supplied or endorsed by TradingView. Read more in the Terms of Use.
Disclaimer
The information and publications are not meant to be, and do not constitute, financial, investment, trading, or other types of advice or recommendations supplied or endorsed by TradingView. Read more in the Terms of Use.