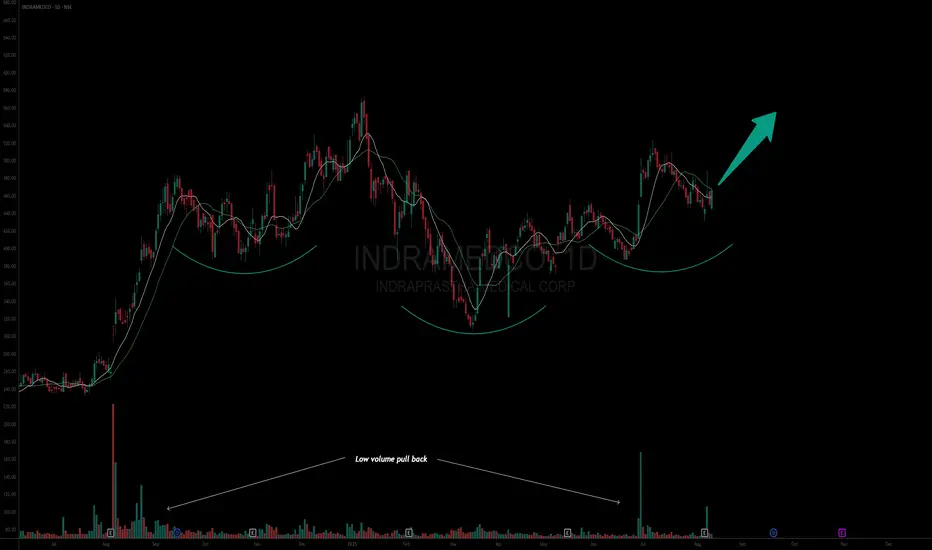
Asset: Indraprastha Medical Corporation Ltd (INDRAMEDCO)
Entry Level: 475
Potential Target: 575 (1st target)
Stop Loss: 435 (~8% risk)
Timeframe: Short to Medium term
Risk to Reward ratio : 1:2.f
Rationale:
Fundamentals -
Fundamentally decent stock with the following attributes:
* ROCE - 39%
* ROE - 30%
* Debt to Equity - 0.05
* Stock PE 25.5 / Industry PE - 65.4 || Stock PBV 7.16 / Industry PBV 6.78 - Company is underpriced
* EPS / Revenue - Has been increasing for the last 6 months
* ADR is 3.9% (Fair but not that high)
* Fundamentally good company
* Hospitals / Health Care provider sector is holding strong
Technical -
* Overall structure - Stock is showing resiliency in times of failing market breadth.
* 200 DMA is sloping up / 50 and 100 DMA is sloping up
* 10 DMA is above 20 DMA but it needs to improve its structure
* Relative Strength is beginning to pick up.
* Multiple timeframe analysis - Weekly structure is indicating towards a potential reverse head and shoulder provided the trend continues.
* Low volume pullback and increasing volume when price makes long range Green candles
Market analysis
* Promoter holding has remained flat / MF and DII has remained flat / Retail holding is high which is not that great.
Cons
* Momentum and ADR is low indicating slow movement potential
* Holding pattern can improve
This analysis is for educational purposes only and should not be considered as financial advice. Trading and investing in financial markets involve significant risk, and past performance is not indicative of future results. You should conduct your own research and consult with a qualified financial advisor before making any trading or investment decisions. The author is not responsible for any financial losses or damages that may result from the use of this information.
Disclaimer
The information and publications are not meant to be, and do not constitute, financial, investment, trading, or other types of advice or recommendations supplied or endorsed by TradingView. Read more in the Terms of Use.
Disclaimer
The information and publications are not meant to be, and do not constitute, financial, investment, trading, or other types of advice or recommendations supplied or endorsed by TradingView. Read more in the Terms of Use.