Full Analysis:
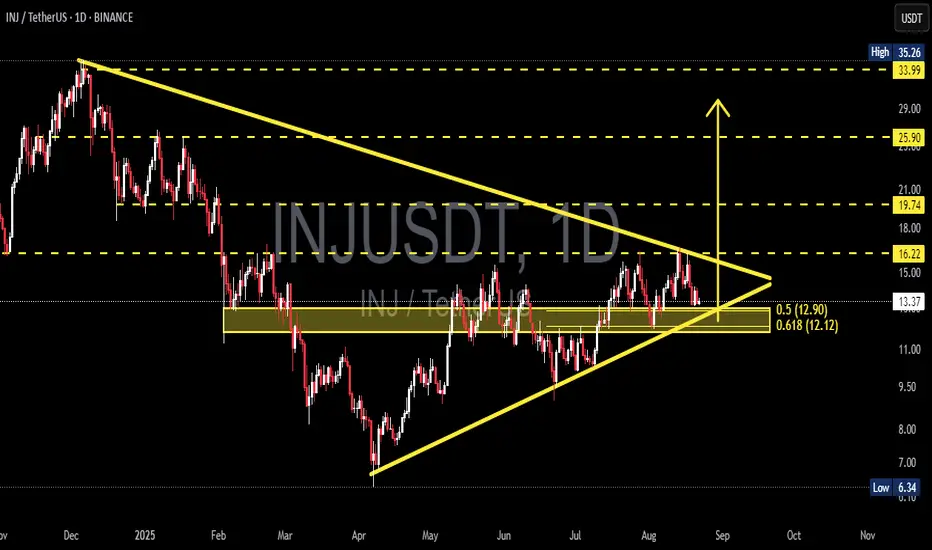
INJ/USDT is currently consolidating within a daily symmetrical triangle pattern, where lower highs (seller pressure) meet higher lows (buyer defense). This pattern usually signals a phase of compression before a strong directional breakout, typically occurring as price approaches the apex of the triangle.
Right now, price sits around 13.35, testing a critical demand zone that overlaps with the 0.5–0.618 Fibonacci retracement (12.90–12.12). This makes the zone a make-or-break area: holding above could fuel a bullish breakout, while a breakdown would likely trigger further bearish momentum.
---
🔼 Bullish Scenario
Trigger: A daily close above the triangle’s upper trendline (~15.0), followed by a confirmed breakout above 16.22.
Additional Confirmation: Increasing volume during breakout.
Upside Targets:
🎯 T1: 16.22 → confirmation of breakout.
🎯 T2: 19.74 (key historical resistance).
🎯 T3: 25.90 (next major resistance).
🎯 T4: 33.99–35.26 (previous high & ultimate bullish objective).
Invalidation: Failure to hold above 16.22 after breakout and a return back inside the triangle.
---
🔽 Bearish Scenario
Trigger: A daily close below the ascending trendline and the 12.90–12.12 demand zone.
Additional Confirmation: Strong selling volume and clear rejection candles below the zone.
Downside Targets:
⚠️ T1: 9.50 (psychological support & measured move projection).
⚠️ T2: 6.34 (major historical low).
Invalidation: Quick recovery and reclaim above 12.9–13.5.
---
📐 Pattern & Technical Logic
Symmetrical Triangle → Neutral structure, representing market indecision before a strong move.
Measured Move Projection → Height of the triangle (~3–4 points) projected from the breakout point → aligns with ~19.7 to the upside or ~9.5 to the downside.
Golden Fibonacci Zone (0.5–0.618 / 12.90–12.12) → Often acts as the last stronghold for buyers in a mid-term structure.
---
📝 Key Insight
If INJ manages to break and sustain above 16.22 with strong volume, it could trigger a major bullish continuation toward higher targets.
Conversely, a decisive breakdown below 12.12 would confirm bearish momentum, opening the door for a deeper retracement toward 9.50 and 6.34.
With volatility squeezing near the apex, a large directional move is very likely in the coming weeks.
---
🎯 Conclusion
INJ is approaching a critical decision point:
Above 16.22 = bullish breakout with significant upside potential.
Below 12.12 = bearish breakdown with deeper correction ahead.
Traders should wait for a confirmed daily breakout before committing to a direction. Whichever side wins, the risk/reward opportunity is substantial.
#INJ #INJUSDT #CryptoAnalysis #SymmetricalTriangle #ChartPattern #PriceAction #Breakout #SupportResistance #Fibonacci #Altcoins #CryptoTrading
✅ Get Free Signals! Join Our Telegram Channel Here: t.me/TheCryptoNuclear
✅ Twitter: twitter.com/crypto_nuclear
✅ Join Bybit : partner.bybit.com/b/nuclearvip
✅ Benefits : Lifetime Trading Fee Discount -50%
✅ Twitter: twitter.com/crypto_nuclear
✅ Join Bybit : partner.bybit.com/b/nuclearvip
✅ Benefits : Lifetime Trading Fee Discount -50%
Disclaimer
The information and publications are not meant to be, and do not constitute, financial, investment, trading, or other types of advice or recommendations supplied or endorsed by TradingView. Read more in the Terms of Use.