📊 Key Technical Indicators
Moving Averages: The stock is trading below its 5-day, 50-day, and 200-day moving averages, all indicating a sell trend.
Relative Strength Index (RSI): The 14-day RSI stands at 39.62, suggesting the stock is in a neutral to bearish condition.
MACD: The MACD is negative, reinforcing the bearish trend.
📈 Support and Resistance Levels
Support Levels: ₹37.84 (weekly pivot), ₹37.56 (short-term support), ₹36.07 (lower range of horizontal trend).
Resistance Levels: ₹39.75 (weekly pivot), ₹39.59 (near-term resistance), ₹41.08 (upper range of horizontal trend).
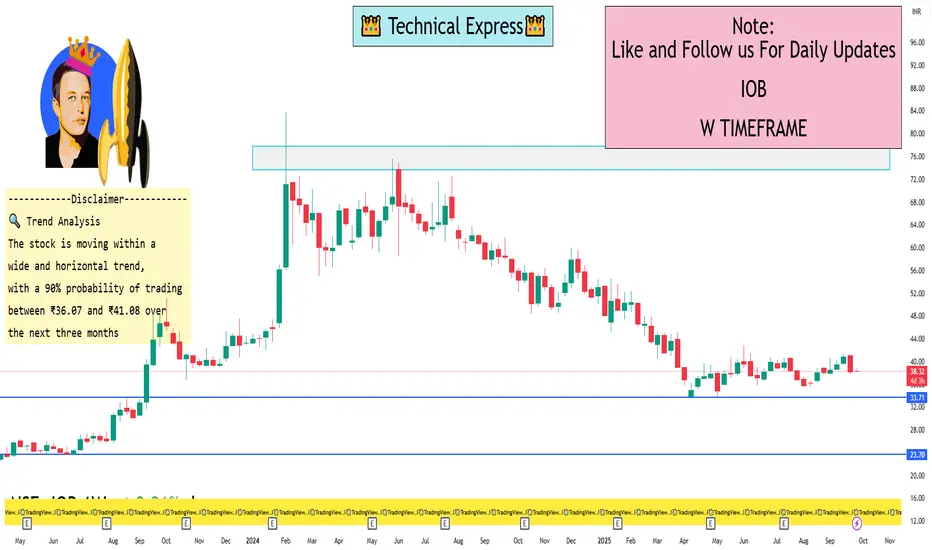
🔍 Trend Analysis
The stock is moving within a wide and horizontal trend, with a 90% probability of trading between ₹36.07 and ₹41.08 over the next three months.
⚠️ Outlook
The prevailing trend is bearish, with no significant positive signals at the moment. A break above the resistance levels could indicate a potential reversal, but currently, the stock remains under pressure.
Moving Averages: The stock is trading below its 5-day, 50-day, and 200-day moving averages, all indicating a sell trend.
Relative Strength Index (RSI): The 14-day RSI stands at 39.62, suggesting the stock is in a neutral to bearish condition.
MACD: The MACD is negative, reinforcing the bearish trend.
📈 Support and Resistance Levels
Support Levels: ₹37.84 (weekly pivot), ₹37.56 (short-term support), ₹36.07 (lower range of horizontal trend).
Resistance Levels: ₹39.75 (weekly pivot), ₹39.59 (near-term resistance), ₹41.08 (upper range of horizontal trend).
🔍 Trend Analysis
The stock is moving within a wide and horizontal trend, with a 90% probability of trading between ₹36.07 and ₹41.08 over the next three months.
⚠️ Outlook
The prevailing trend is bearish, with no significant positive signals at the moment. A break above the resistance levels could indicate a potential reversal, but currently, the stock remains under pressure.
I built a Buy & Sell Signal Indicator with 85% accuracy.
📈 Get access via DM or
WhatsApp: wa.link/d997q0
Contact - +91 76782 40962
| Email: techncialexpress@gmail.com
| Script Coder | Trader | Investor | From India
📈 Get access via DM or
WhatsApp: wa.link/d997q0
Contact - +91 76782 40962
| Email: techncialexpress@gmail.com
| Script Coder | Trader | Investor | From India
Related publications
Disclaimer
The information and publications are not meant to be, and do not constitute, financial, investment, trading, or other types of advice or recommendations supplied or endorsed by TradingView. Read more in the Terms of Use.