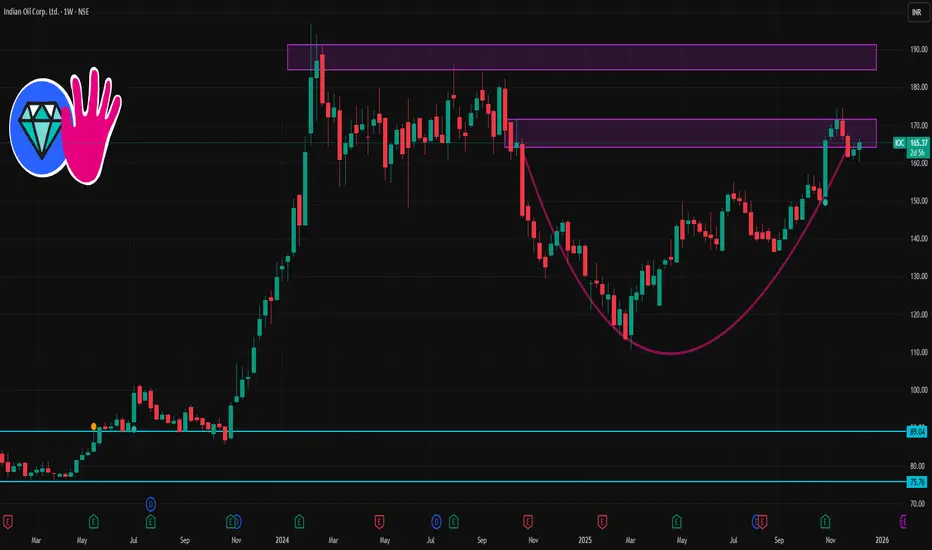
🔎 Current Snapshot
Latest price on NSE: ~ ₹163.00–₹163.50.
52‑week trading range: ₹110.72 (low) ⇒ ₹174.50 (high).
On moving averages: price is above 50‑day, 100‑day and 200‑day MA — a bullish structural sign, though short‑term oscillators are mixed/neutral.
Recent 1‑week performance: modest gains (price near upper of recent short‑term range) — suggests a cautious bullish bias, not a runaway rally.
✅ My “Base‑Case” 1‑Week Scenarios
Scenario A – Mild Bullish (likely): Price hovers between ₹160–165, bouncing off support ~₹160 and possibly testing ₹165–166.
Scenario B – Bullish Breakout (if catalysts align): Break above ₹165–166 → move toward ₹167–168 (maybe touching ₹170).
Scenario C – Weak/Neutral (in adverse market): If oil/market turns negative & price breaks below ₹160, watch for dips toward ₹158–159.
Related publications
Disclaimer
The information and publications are not meant to be, and do not constitute, financial, investment, trading, or other types of advice or recommendations supplied or endorsed by TradingView. Read more in the Terms of Use.
Related publications
Disclaimer
The information and publications are not meant to be, and do not constitute, financial, investment, trading, or other types of advice or recommendations supplied or endorsed by TradingView. Read more in the Terms of Use.