📊 1-Hour Timeframe: Support & Resistance Levels
Based on recent intraday data, here are the key support and resistance levels for IPCA Laboratories Ltd. on the 1-hour timeframe:
🔽 Support Levels:
S1: ₹1,324.36
S2: ₹1,323.13
S3: ₹1,322.06
🔼 Resistance Levels:
R1: ₹1,326.66
R2: ₹1,327.73
R3: ₹1,328.96
These levels are derived from standard pivot point calculations and are widely used by traders to identify potential reversal points.
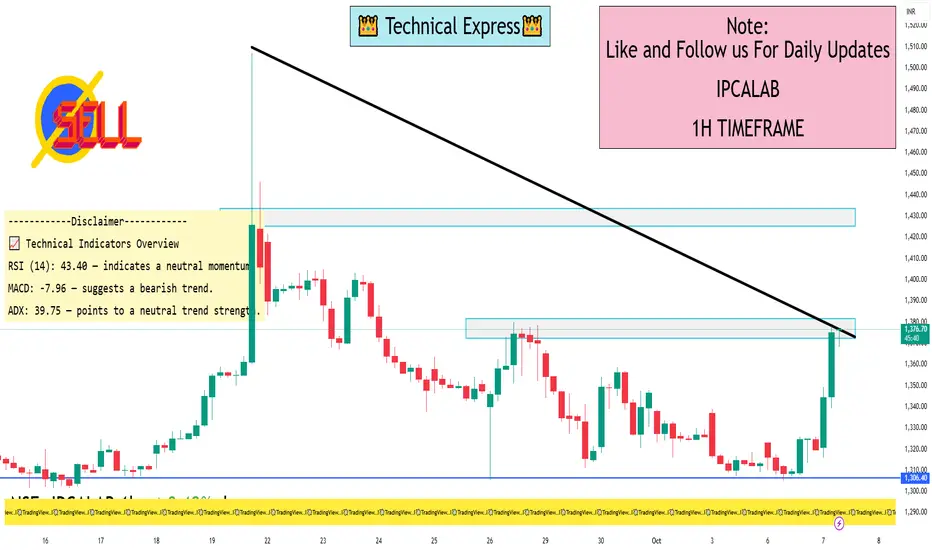
📈 Technical Indicators Overview
RSI (14): 43.40 — indicates a neutral momentum.
MACD: -7.96 — suggests a bearish trend.
ADX: 39.75 — points to a neutral trend strength.
Moving Averages:
5-period EMA: ₹1,325.64 — indicates a buy signal.
50-period EMA: ₹1,352.22 — suggests a sell signal.
200-period EMA: ₹1,351.26 — indicates a sell signal.
Pivot Points:
Pivot: ₹1,325.43
R1: ₹1,326.66
S1: ₹1,324.36
These indicators collectively suggest a cautious outlook for short-term traders, with a prevailing bearish sentiment.
Based on recent intraday data, here are the key support and resistance levels for IPCA Laboratories Ltd. on the 1-hour timeframe:
🔽 Support Levels:
S1: ₹1,324.36
S2: ₹1,323.13
S3: ₹1,322.06
🔼 Resistance Levels:
R1: ₹1,326.66
R2: ₹1,327.73
R3: ₹1,328.96
These levels are derived from standard pivot point calculations and are widely used by traders to identify potential reversal points.
📈 Technical Indicators Overview
RSI (14): 43.40 — indicates a neutral momentum.
MACD: -7.96 — suggests a bearish trend.
ADX: 39.75 — points to a neutral trend strength.
Moving Averages:
5-period EMA: ₹1,325.64 — indicates a buy signal.
50-period EMA: ₹1,352.22 — suggests a sell signal.
200-period EMA: ₹1,351.26 — indicates a sell signal.
Pivot Points:
Pivot: ₹1,325.43
R1: ₹1,326.66
S1: ₹1,324.36
These indicators collectively suggest a cautious outlook for short-term traders, with a prevailing bearish sentiment.
I built a Buy & Sell Signal Indicator with 85% accuracy.
📈 Get access via DM or
WhatsApp: wa.link/d997q0
Contact - +91 76782 40962
| Email: techncialexpress@gmail.com
| Script Coder | Trader | Investor | From India
📈 Get access via DM or
WhatsApp: wa.link/d997q0
Contact - +91 76782 40962
| Email: techncialexpress@gmail.com
| Script Coder | Trader | Investor | From India
Related publications
Disclaimer
The information and publications are not meant to be, and do not constitute, financial, investment, trading, or other types of advice or recommendations supplied or endorsed by TradingView. Read more in the Terms of Use.