Trend line Resistance:
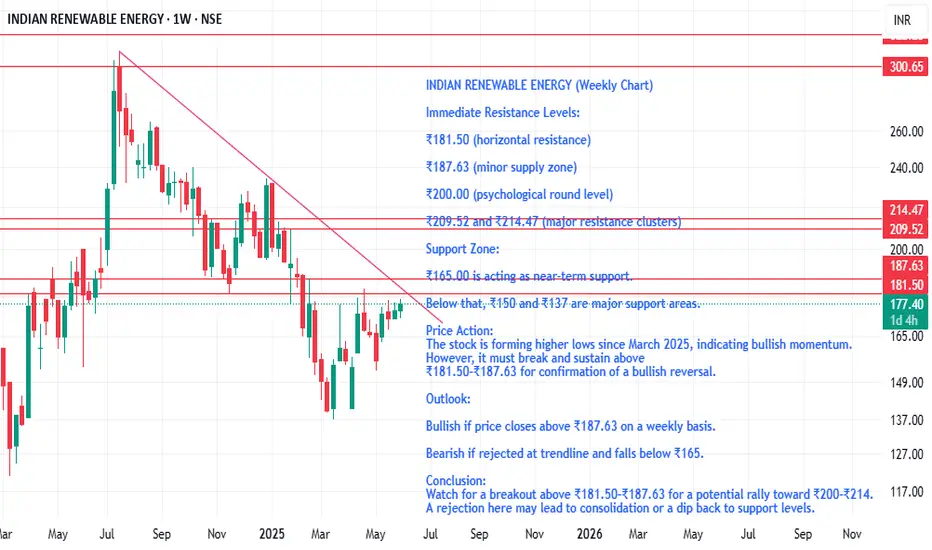
The price is approaching a descending trend line resistance drawn from the July 2024 highs. It is currently testing this line, indicating a crucial breakout or rejection zone.
Immediate Resistance Levels:
₹181.50 (horizontal resistance)
₹187.63 (minor supply zone)
₹200.00 (psychological round level)
₹209.52 and ₹214.47 (major resistance clusters)
Support Zone:
₹165.00 is acting as near-term support.
Below that, ₹150 and ₹137 are major support areas.
Price Action:
The stock is forming higher lows since March 2025, indicating bullish momentum. However, it must break and sustain above ₹181.50–₹187.63 for confirmation of a bullish reversal.
Outlook:
Bullish if price closes above ₹187.63 on a weekly basis.
Bearish if rejected at trendline and falls below ₹165.
Conclusion:
Watch for a breakout above ₹181.50–₹187.63 for a potential rally toward ₹200–₹214. A rejection here may lead to consolidation or a dip back to support levels.
Disclaimer
The information and publications are not meant to be, and do not constitute, financial, investment, trading, or other types of advice or recommendations supplied or endorsed by TradingView. Read more in the Terms of Use.
Disclaimer
The information and publications are not meant to be, and do not constitute, financial, investment, trading, or other types of advice or recommendations supplied or endorsed by TradingView. Read more in the Terms of Use.