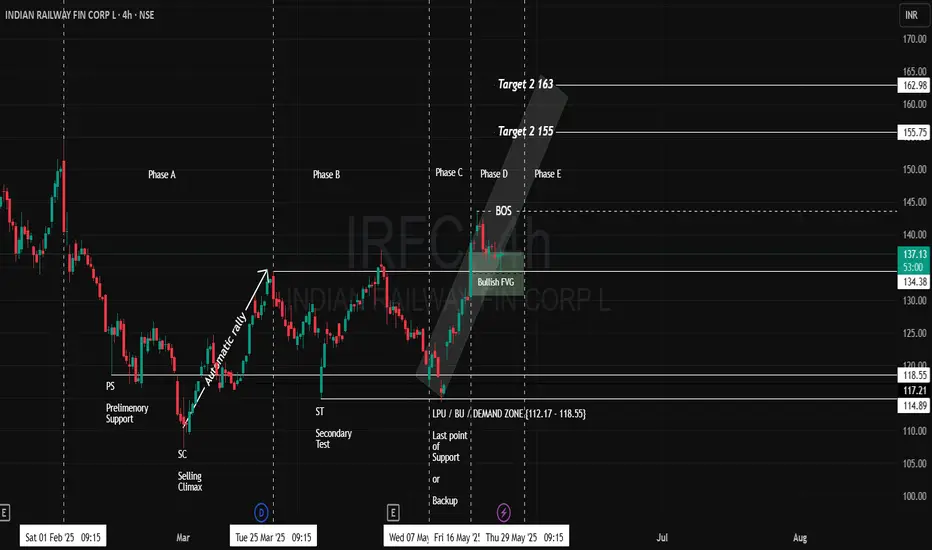
Trade Projection:
Entry Zones:
Targets:
Wyckoff Method Analysis:
Phase A (Accumulation):
According to the Wyckoff Method, accumulation began with the stock trading in the range of 107 to 134, marking the recent swing low within Phase A.
Phase B (Testing Supply):
During this phase, the price action retested the secondary support around 114 and then rallied to 137. This movement suggests the formation of a higher high (HH) and higher low (HL) structure, although a clear confirmation of an uptrend was not yet established.
Phase C (Spring):
Phase C is typically identified by a "spring" or a false breakdown, which tests demand and confirms strength. In this case, the stock dipped to a low of 114.50 and then rallied sharply to 143.50. This rally also formed a bullish Fair Value Gap (FVG) between 130 and 140.50, indicating institutional buying interest.
Phase E (Mark-Up):
As observed, price action revisited and mitigated the bullish FVG zone between 130 and 140.50, consistent with SMC principles. The current market price is 137.02, confirming this mitigation and suggesting the mark-up phase is underway.
Disclaimer: lnkd.in/gJJDnvn2
Entry Zones:
- Primary Entry: Within the bullish FVG zone between 135 and 140.
- Secondary Entry: On a breakout above the recent swing high of 143.45, which also serves as a Break of Structure (BOS) point relative to the FVG.
Targets:
- Primary Target: 155 (approx. +12%)
- Secondary Target: 163 (approx. +20%)
- Stop loss at 125
Wyckoff Method Analysis:
Phase A (Accumulation):
According to the Wyckoff Method, accumulation began with the stock trading in the range of 107 to 134, marking the recent swing low within Phase A.
Phase B (Testing Supply):
During this phase, the price action retested the secondary support around 114 and then rallied to 137. This movement suggests the formation of a higher high (HH) and higher low (HL) structure, although a clear confirmation of an uptrend was not yet established.
Phase C (Spring):
Phase C is typically identified by a "spring" or a false breakdown, which tests demand and confirms strength. In this case, the stock dipped to a low of 114.50 and then rallied sharply to 143.50. This rally also formed a bullish Fair Value Gap (FVG) between 130 and 140.50, indicating institutional buying interest.
Phase E (Mark-Up):
As observed, price action revisited and mitigated the bullish FVG zone between 130 and 140.50, consistent with SMC principles. The current market price is 137.02, confirming this mitigation and suggesting the mark-up phase is underway.
Disclaimer: lnkd.in/gJJDnvn2
Disclaimer
The information and publications are not meant to be, and do not constitute, financial, investment, trading, or other types of advice or recommendations supplied or endorsed by TradingView. Read more in the Terms of Use.
Disclaimer
The information and publications are not meant to be, and do not constitute, financial, investment, trading, or other types of advice or recommendations supplied or endorsed by TradingView. Read more in the Terms of Use.
