📈 Forecast Description
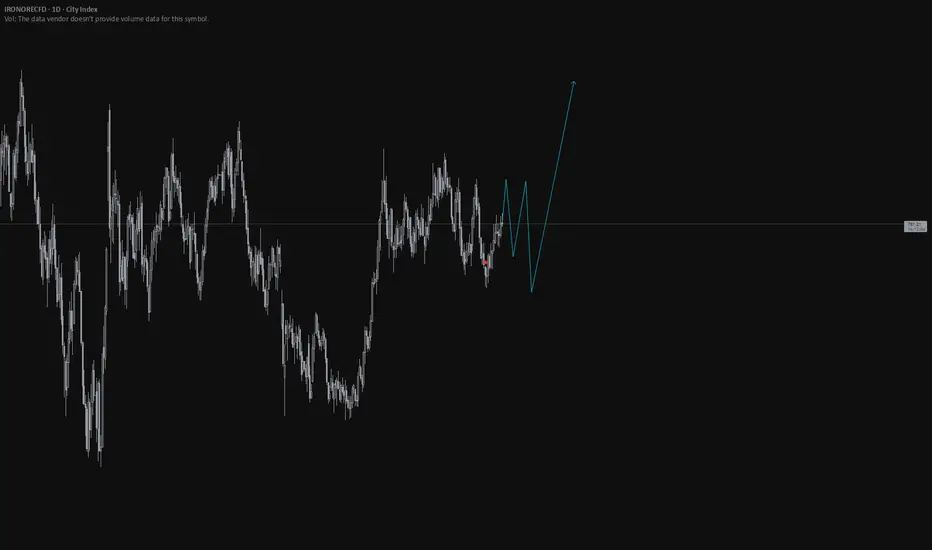
The blue line indicates a highly bullish and volatile forecast following a prior period of consolidation or price bottoming.
Initial Phase (Consolidation/Recovery): After the historical data (white line) reaches what appears to be a low point, the forecast begins with a period of tentative recovery and consolidation. The blue line shows several minor peaks and troughs (a small "W" or zigzag pattern), suggesting that the upward trend might not be immediate or smooth. This indicates an initial phase of battling resistance and finding strong support, potentially around the level of the lower dotted line.
Correction/Dip (The V-Shape): The forecast shows a noticeable sharp downward dip after the initial consolidation phase. This suggests a potential pullback or correction before the major rally begins. This V-shaped segment could represent a final flush-out of sellers or a test of a key support level.
Aggressive Uptrend (The Rally): Following the correction, the forecast enters a phase of aggressive, accelerated growth. The upward swings become significantly steeper and the overall trajectory is a strong, sustained move to the upside. The subsequent dips become shallower and the rallies become much stronger, indicating that the buying pressure is dominating the market.
Conclusion (Target): The forecast ends with the line pointing sharply up and off the chart's visible range, suggesting a high target price or a belief that the value will enter a strong, open-ended parabolic rally or new high-growth channel.
෴TURKI෴
Disclaimer
The information and publications are not meant to be, and do not constitute, financial, investment, trading, or other types of advice or recommendations supplied or endorsed by TradingView. Read more in the Terms of Use.
෴TURKI෴
Disclaimer
The information and publications are not meant to be, and do not constitute, financial, investment, trading, or other types of advice or recommendations supplied or endorsed by TradingView. Read more in the Terms of Use.