🔎 Overview
⸻⸻⸻⸻⸻⸻⸻⸻⸻⸻
📔 Concept
⸻⸻⸻⸻⸻⸻⸻⸻⸻⸻
📌 How to Use
⸻⸻⸻⸻⸻⸻⸻⸻⸻⸻
📊 Chart Explanation
⸻⸻⸻⸻⸻⸻⸻⸻⸻⸻
👀 Observation
⸻⸻⸻⸻⸻⸻⸻⸻⸻⸻
💡 Conclusion
⸻⸻⸻⸻⸻⸻⸻⸻⸻⸻
⚠️ Disclaimer
The Fair Value Gap (FVG) is a unique price imbalance or inefficiency on a price chart where the market rapidly moves, leaving one or more candles without overlapping wicks between highs and lows.
This signifies aggressive buying or selling, resulting in a “gap” of untraded prices.
Once spotted, FVGs often act as magnets, drawing price back to fill the gap — and later serve as dynamic support or resistance zones, depending on the market direction.
⸻⸻⸻⸻⸻⸻⸻⸻⸻⸻
📔 Concept
A Fair Value Gap forms when:
1️⃣ Resistance FVG -- A strong impulsive move causes the low of the first candle and the high of the third candle (in a three-candle sequence) to fail to overlap, leaving a visible gap.
2️⃣Support FVG -- A strong impulsive move causes the high of the first candle and the low of the third candle (in a three-candle sequence) to fail to overlap, leaving a visible gap.
3️⃣ Imbalance -- This gap highlights an area where orders were skipped, signaling an imbalance between buyers and sellers.
4️⃣ Rebalance -- When revisited, a Bullish FVG often acts as support, while a Bearish FVG acts as resistance, as price reacts to rebalance the inefficiency before the trend continues.
⸻⸻⸻⸻⸻⸻⸻⸻⸻⸻
📌 How to Use
✅ Validation → A valid FVG exists as long as the gap remains unfilled, and traders watch for price to revisit and react to it.
🟩 Bullish FVG → Support: When price retraces into the gap and finds buying interest, the zone holds as support.
🔴 Bearish FVG → Resistance: When price rallies into a bearish gap and faces rejection, the zone holds as resistance.
❌ Devalidation → If price decisively closes inside the FVG, the gap is considered “filled,” and the setup loses significance.
Typically, the lowest unfilled bullish FVG below price in an uptrend (and the highest bearish FVG above in a downtrend) carries more weight and is prioritized for confluence.
⸻⸻⸻⸻⸻⸻⸻⸻⸻⸻
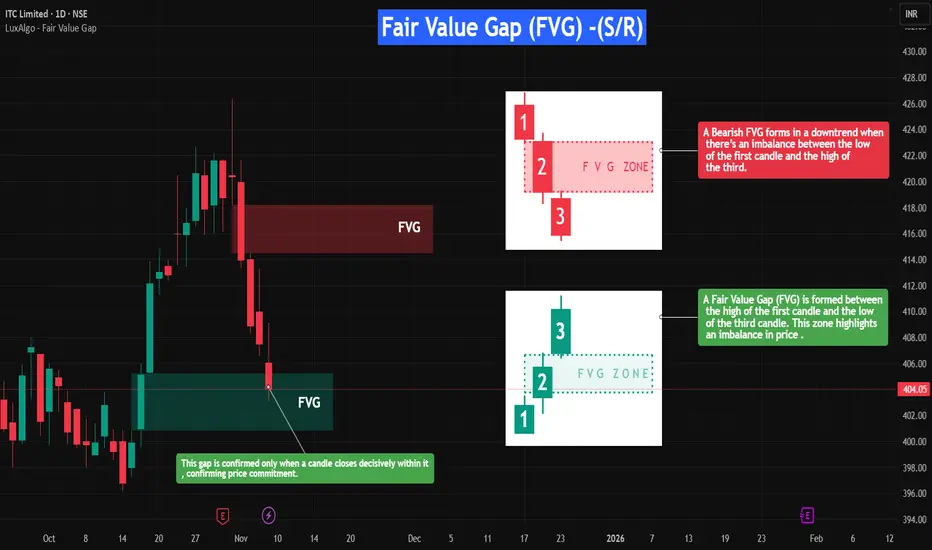
📊 Chart Explanation
Symbol →ITC
Timeframe → 1D
On the right-hand side, the Fair Value Gaps (FVGs) are illustrated in detail to give a closer look at how they form and function.
These visual examples explain how FVGs represent price inefficiencies — zones that later act as dynamic support or resistance once price revisits them.
On the left-hand side, you can see real-time examples of FVGs forming within live price action.
When a candle closes decisively inside a bullish FVG, it confirms price commitment, allowing the zone to act as support and potentially propel price upward.(These are plotted using open sourced indicator )
This setup beautifully demonstrates how understanding FVG structure helps identify high-probability reaction zones where the market seeks to rebalance itself.
⸻⸻⸻⸻⸻⸻⸻⸻⸻⸻
👀 Observation
Fair Value Gaps work best in volatile markets or during strong impulsive moves.
When price revisits an unfilled gap, the reaction helps define new support or resistance.
Combining FVGs with key structural levels, volume analysis, or momentum indicators (like RSI or Moving Averages) improves reliability.
Always prioritize clean, unfilled gaps aligned with the trend direction for higher conviction.
⸻⸻⸻⸻⸻⸻⸻⸻⸻⸻
💡 Conclusion
The Fair Value Gap not only signals where the market may “rebalance” itself after price inefficiencies but also identifies potential support and resistance zones.
Recognizing how bullish and bearish FVGs interact with price allows traders to anticipate reactions, manage risk, and refine entries and targets with greater accuracy.
⸻⸻⸻⸻⸻⸻⸻⸻⸻⸻
⚠️ Disclaimer
📘 For educational purposes only.
🙅 Not SEBI registered.
❌ Not a buy/sell recommendation.
🧠 Purely a learning resource.
📊 Not Financial Advice.
Disclaimer
The information and publications are not meant to be, and do not constitute, financial, investment, trading, or other types of advice or recommendations supplied or endorsed by TradingView. Read more in the Terms of Use.
Disclaimer
The information and publications are not meant to be, and do not constitute, financial, investment, trading, or other types of advice or recommendations supplied or endorsed by TradingView. Read more in the Terms of Use.