🔵 Stock: JAI BALAJI (Weekly)
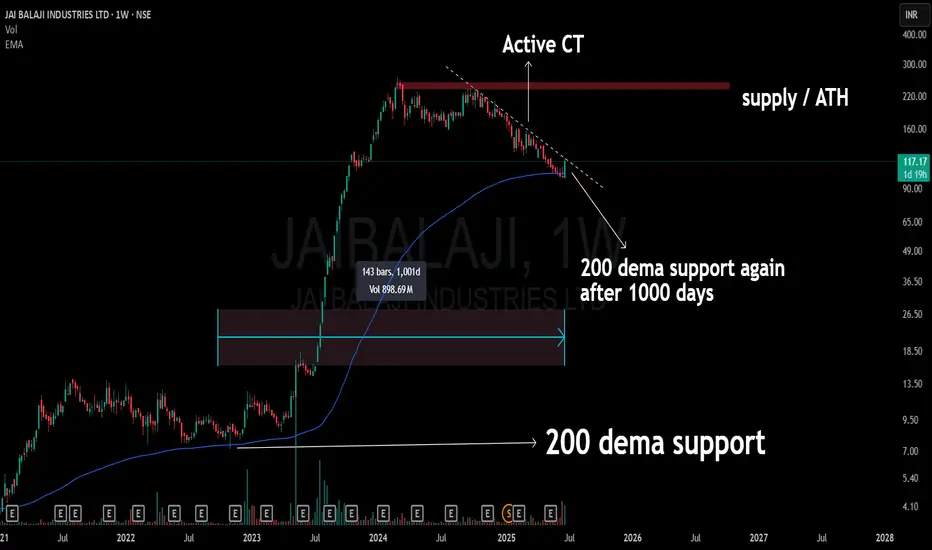
🔥 Support Revisit: Back to the 200 DEMA after 1000 days
A level that once acted as the launchpad.
Current structure shows an active compression trend (CT) right into this long-term dynamic support.
The chart also aligns below a major supply zone / ATH band, keeping the broader context in check.
📉 No prediction. No call. Just structure, levels, and time-tested zones doing the talking.
🎯 Master My Self-Made Trading Strategy
📈 Telegram (Learn Today): t.me/hashtaghammer
✅ WhatsApp (Learn Today): wa.me/919455664601
📈 Telegram (Learn Today): t.me/hashtaghammer
✅ WhatsApp (Learn Today): wa.me/919455664601
Related publications
Disclaimer
The information and publications are not meant to be, and do not constitute, financial, investment, trading, or other types of advice or recommendations supplied or endorsed by TradingView. Read more in the Terms of Use.