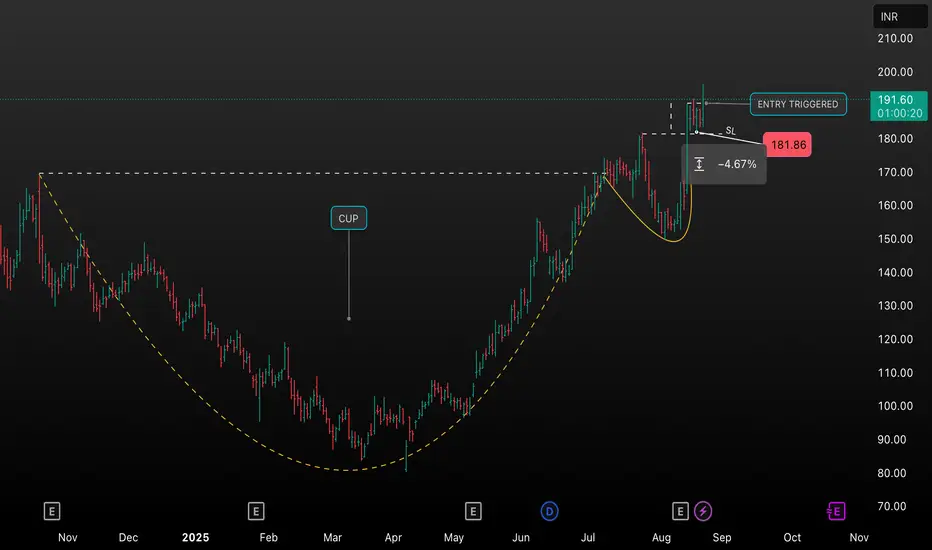
This TradingView chart shows JM Financial’s daily price action forming a classic cup and handle pattern. The price has broken out above the resistance line, triggering a bullish entry opportunity. Stop-loss (SL) is recommended at 181.86 (–4.67% from breakout), with potential for a continued uptrend. Key features:
• Pattern: Cup & Handle
• Entry: Breakout above resistance (triggered)
• Stop Loss: 181.86
• Timeframe: Daily
• Indicator: Volume supports breakout
Share your thoughts or analysis on this setup and let’s discuss the targets or risk management strategies for maximizing potential profits.
• Pattern: Cup & Handle
• Entry: Breakout above resistance (triggered)
• Stop Loss: 181.86
• Timeframe: Daily
• Indicator: Volume supports breakout
Share your thoughts or analysis on this setup and let’s discuss the targets or risk management strategies for maximizing potential profits.
Disclaimer
The information and publications are not meant to be, and do not constitute, financial, investment, trading, or other types of advice or recommendations supplied or endorsed by TradingView. Read more in the Terms of Use.
Disclaimer
The information and publications are not meant to be, and do not constitute, financial, investment, trading, or other types of advice or recommendations supplied or endorsed by TradingView. Read more in the Terms of Use.