After a prolonged downtrend from its September 2024 peak, JSW Energy is showing clear signs of a potential trend reversal, as it meticulously forms a classic bullish pattern. The stock is now approaching a critical decision point.
The Setup: An Ascending Triangle
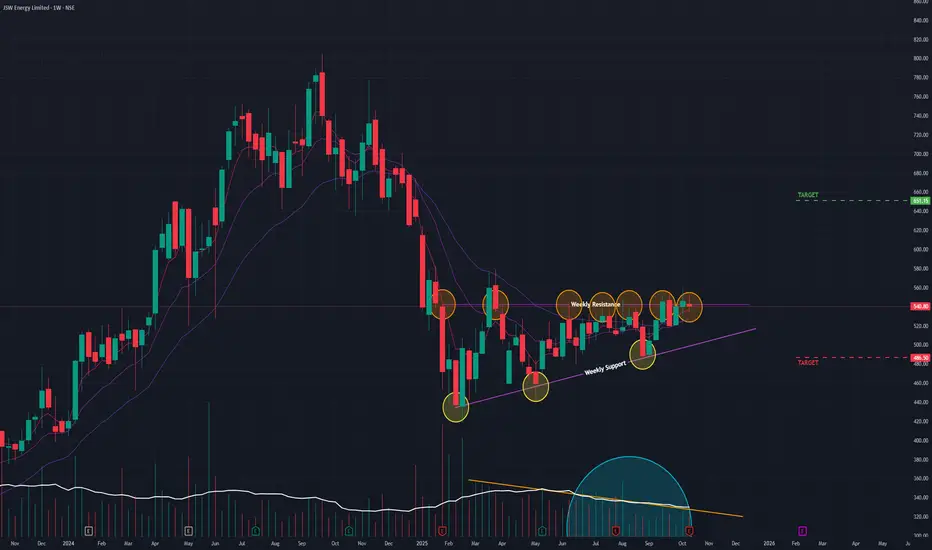
Since February 2025, the stock has been forming a classic Ascending Triangle. This bullish pattern is characterized by:
- A series of Higher Lows, indicating that buyers are becoming more aggressive on each pullback.
- A flat horizontal resistance of Equal Highs, which has rejected several breakout attempts in recent weeks.
Crucially, as is typical for this type of consolidation pattern, trading volume has been noticeably drying up. This suggests that selling pressure is diminishing and energy is being stored for a potential significant move.
A Nuanced Technical Picture
The technical indicators suggest a trend that is in the process of turning bullish but has not yet received full confirmation across all timeframes:
- EMA: The short-term Exponential Moving Averages (EMAs) show a bullish crossover on the Weekly chart, but the longer-term Monthly chart is still awaiting this signal.
- RSI: The Monthly RSI is already rising (a positive long-term sign), but the Weekly RSI has yet to follow suit with a definitive upward trend.
This mix indicates that while medium-term strength is building, a decisive breakout is needed to align all timeframes and confirm a new, sustained uptrend.
Outlook and Key Triggers to Watch
The resolution of this triangle will likely dictate the stock's next major move.
- Bullish Breakout Scenario: A decisive close above the horizontal resistance on a surge of volume would confirm the breakout. This would signal the start of a new uptrend, with a potential next target of ₹650.
- Bearish Scenario: If the stock loses momentum and fails to break out, it could fall back to test the rising support trendline of the triangle. The key support level to watch in this case is ₹485.
The price action in the coming week will be critical. The focus should be on whether the bulls can finally generate the momentum needed to break through the overhead resistance and complete this bullish reversal pattern.
The Setup: An Ascending Triangle
Since February 2025, the stock has been forming a classic Ascending Triangle. This bullish pattern is characterized by:
- A series of Higher Lows, indicating that buyers are becoming more aggressive on each pullback.
- A flat horizontal resistance of Equal Highs, which has rejected several breakout attempts in recent weeks.
Crucially, as is typical for this type of consolidation pattern, trading volume has been noticeably drying up. This suggests that selling pressure is diminishing and energy is being stored for a potential significant move.
A Nuanced Technical Picture
The technical indicators suggest a trend that is in the process of turning bullish but has not yet received full confirmation across all timeframes:
- EMA: The short-term Exponential Moving Averages (EMAs) show a bullish crossover on the Weekly chart, but the longer-term Monthly chart is still awaiting this signal.
- RSI: The Monthly RSI is already rising (a positive long-term sign), but the Weekly RSI has yet to follow suit with a definitive upward trend.
This mix indicates that while medium-term strength is building, a decisive breakout is needed to align all timeframes and confirm a new, sustained uptrend.
Outlook and Key Triggers to Watch
The resolution of this triangle will likely dictate the stock's next major move.
- Bullish Breakout Scenario: A decisive close above the horizontal resistance on a surge of volume would confirm the breakout. This would signal the start of a new uptrend, with a potential next target of ₹650.
- Bearish Scenario: If the stock loses momentum and fails to break out, it could fall back to test the rising support trendline of the triangle. The key support level to watch in this case is ₹485.
The price action in the coming week will be critical. The focus should be on whether the bulls can finally generate the momentum needed to break through the overhead resistance and complete this bullish reversal pattern.
Disclaimer: This analysis is my personal view & for educational purposes only. They shall not be construed as trade or investment advice. Before making any financial decision, it is imperative that you consult with a qualified financial professional.
Disclaimer
The information and publications are not meant to be, and do not constitute, financial, investment, trading, or other types of advice or recommendations supplied or endorsed by TradingView. Read more in the Terms of Use.