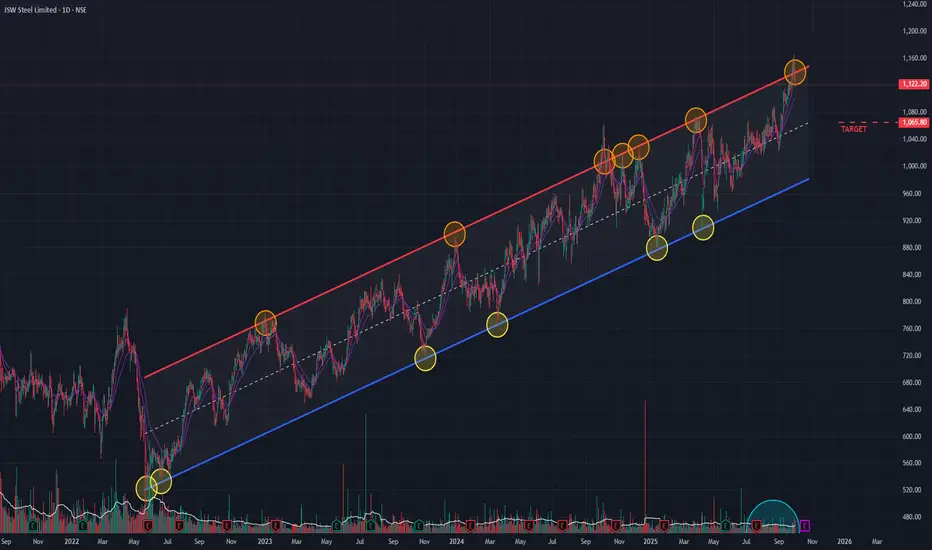
JSW Steel is currently trading at a critical juncture, testing the upper resistance trendline of a well-defined channel pattern that has been in place since May 2022. Historically, this trendline has acted as a strong barrier, often leading to a price reversal back towards the lower end of the channel.
Bearish Indicators Emerge 📉
Several technical indicators are suggesting that the upward momentum is waning and a potential downturn could be imminent:
- RSI Divergence: The Relative Strength Index (RSI) is showing bearish signs on the daily chart and is also starting a negative crossover on the weekly chart.
- Momentum Shift: Short-term Exponential Moving Averages (EMAs) on the daily chart are entering a negative crossover, signaling a potential shift in short-term momentum to the downside.
- Rising Bearish Volume: There has been a noticeable increase in selling volume as the stock approaches this resistance, indicating strengthening bearish pressure.
Outlook and Key Levels
Given the stock's position at a historical resistance level combined with multiple bearish technical signals, a cautious approach is warranted.
If the channel pattern holds true, the stock could reverse from this level and head downwards. A potential downside target in this scenario would be the support level near ₹1,065. The price action in the coming sessions will be crucial to confirm this potential reversal.
Disclaimer: This analysis is my personal view & for educational purposes only. They shall not be construed as trade or investment advice. Before making any financial decision, it is imperative that you consult with a qualified financial professional.
Disclaimer
The information and publications are not meant to be, and do not constitute, financial, investment, trading, or other types of advice or recommendations supplied or endorsed by TradingView. Read more in the Terms of Use.