Ticker: NSE: KFINTECH | Sector: Financial Services & Technology
CMP: 1149.00
Rating: ⭐⭐⭐⭐ (Bullish Breakout Setup – Educational Purposes Only)
Pattern Observed: 📈 Chart Pattern – Range Breakout from Base Support
Candlestick Pattern: Bullish Marubozu | Breakout Candle
📈 KFin Technologies – Bullish Breakout from Consolidation | STWP Analysis
________________________________________
🏦 Stock Introduction
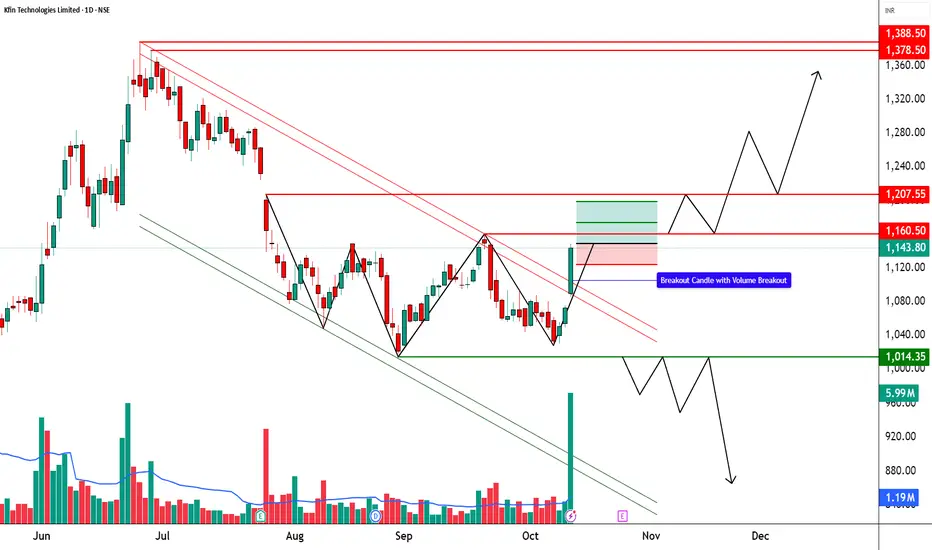
KFin Technologies Ltd. has recently shown a remarkable shift in momentum, breaking out from its prolonged consolidation phase. The stock has moved decisively from its base near ₹1,018, signaling renewed buying interest and accumulation by institutional players. The breakout candle, accompanied by a strong surge in volume, positions KFin Technologies as one of the most promising short-term bullish setups in the current market structure.
________________________________________
💹 Price Action Overview
The stock displayed a powerful bullish candle, breaking above key resistance levels with conviction. The stock has now flipped its master level of ₹1,084.59 from resistance into strong support, confirming that bulls are taking control.
________________________________________
🟨 Technical Indicators Summary The chart reflects a strong bullish candle supported by multiple indicator confirmations. There’s a clear RSI breakout, signaling renewed buying strength, while a MACD crossover adds momentum confirmation to the uptrend. The Bullish SuperTrend indicator aligns with the price movement, reinforcing the positive sentiment. Additionally, a Bollinger Band Squeeze-Off breakout is expected, suggesting that volatility expansion may drive the price higher in the coming sessions. Altogether, these technical signals point toward a powerful short-term bullish momentum with potential for continuation.
________________________________________
🟩 Trade Analysis A clear bullish breakout setup is visible with a strong entry at ₹1,149, supported by impressive momentum and extremely high volume. The candle structure confirms aggressive buying interest, indicating renewed confidence in the stock. The stop loss is placed at ₹1,028.35, offering a defined risk of ₹120.65 per share, which keeps the trade well-balanced. This move also coincides with a master level of ₹1,084.59, now acting as a solid support zone. The surge in price, combined with high volume participation, validates the breakout strength and suggests potential for follow-through in the next trading session. On the upside, the price could face immediate resistance at ₹1,166.73, followed by ₹1,189.67 and ₹1,230.33, which will serve as profit-booking zones if the momentum sustains. Meanwhile, possible support levels are positioned at ₹1,103.13, ₹1,062.47, and ₹1,039.53, giving the setup a strong base for any short-term pullback. The surge in price and volume validates this breakout’s strength, suggesting potential continuation towards higher resistances in the near term. The volume spike of nearly 6 million indicates institutional participation, validating the strength of the breakout. Key support levels are placed at ₹1,105 (23.6% retracement) and ₹1,018 (base support), offering a solid foundation for the ongoing uptrend. On the upside, immediate resistance lies around ₹1,160 (38.2% level), followed by ₹1,203 (50%), ₹1,247 (61.8%), and ₹1,309 (78.6%) — these Fibonacci levels will act as potential profit-booking zones if momentum sustains. With the RSI and CCI both showing bullish crossovers, and momentum indicators confirming strength, the price action suggests a continuation pattern towards ₹1,200+ levels in the near term.
________________________________________
KFin Technologies has delivered a strong bullish breakout right from its bottom range support near ₹1,018.7, confirming renewed buying interest after a prolonged consolidation phase. The stock has respected its lower demand zone multiple times, and this recent breakout comes with a powerful surge in volume (~6M) — a strong sign of accumulation and institutional participation. On a broader structure, the stock continues to trade within a wide range between ₹1,018 (bottom) and ₹1,378 (top) — and a sustained move above the mid-range resistance can open the path toward the upper band. This price behavior, combined with strong momentum indicators and high volume, signals the potential beginning of a range-to-range rally in the coming sessions.
________________________________________
Final Outlook:
Momentum: Strong | Trend: Bullish | Risk: Moderate | Volume: High
________________________________________
💡 Learning Note
This setup demonstrates the power of combining price action, Fibonacci levels, and volume confirmation. A bullish breakout supported by heavy volume, indicator alignment, and a clean structure often offers one of the most reliable swing trade frameworks. Pullbacks into fib-based demand zones followed by renewed buying are high-probability continuation setups.
________________________________________
⚠️ Disclosure & Disclaimer – Please Read Carefully
The information shared here is meant purely for learning and awareness. It is not a buy or sell recommendation and should not be taken as investment advice. I am not a SEBI-registered investment adviser, and all views expressed are based on personal study, chart patterns, and publicly available market data.
Trading—whether in stocks or options—carries risk. Markets can move unexpectedly, and losses can sometimes exceed the money you have invested. Past performance or past setups do not guarantee future results.
If you are a beginner, treat this as a guide to understand how the market works and practice on paper trades before risking real money. If you are experienced, always assess your own risk, position sizing, and strategy suitability before entering trades.
Consult a SEBI-registered financial adviser before making any real trading decision. By engaging with this content, you acknowledge full responsibility for your trades and investments.
Position Status: No active position in KFINTECH at the time of analysis.
Data Source: TradingView & NSE India (Past Chart Reference) (Historical levels)
💬 Found this useful?
🔼 Give this post a Boost to help more traders discover clean, structured learning.
✍️ Drop your thoughts, questions, or setups in the comments — let’s grow together!
🔁 Share with fellow traders and beginners to spread awareness.
👉 “If you liked this breakdown, follow for more clean, structured setups with discipline at the core.”
🚀 Stay Calm. Stay Clean. Trade With Patience.
Trade Smart | Learn Zones | Be Self-Reliant 📊
CMP: 1149.00
Rating: ⭐⭐⭐⭐ (Bullish Breakout Setup – Educational Purposes Only)
Pattern Observed: 📈 Chart Pattern – Range Breakout from Base Support
Candlestick Pattern: Bullish Marubozu | Breakout Candle
📈 KFin Technologies – Bullish Breakout from Consolidation | STWP Analysis
________________________________________
🏦 Stock Introduction
KFin Technologies Ltd. has recently shown a remarkable shift in momentum, breaking out from its prolonged consolidation phase. The stock has moved decisively from its base near ₹1,018, signaling renewed buying interest and accumulation by institutional players. The breakout candle, accompanied by a strong surge in volume, positions KFin Technologies as one of the most promising short-term bullish setups in the current market structure.
________________________________________
💹 Price Action Overview
The stock displayed a powerful bullish candle, breaking above key resistance levels with conviction. The stock has now flipped its master level of ₹1,084.59 from resistance into strong support, confirming that bulls are taking control.
________________________________________
🟨 Technical Indicators Summary The chart reflects a strong bullish candle supported by multiple indicator confirmations. There’s a clear RSI breakout, signaling renewed buying strength, while a MACD crossover adds momentum confirmation to the uptrend. The Bullish SuperTrend indicator aligns with the price movement, reinforcing the positive sentiment. Additionally, a Bollinger Band Squeeze-Off breakout is expected, suggesting that volatility expansion may drive the price higher in the coming sessions. Altogether, these technical signals point toward a powerful short-term bullish momentum with potential for continuation.
________________________________________
🟩 Trade Analysis A clear bullish breakout setup is visible with a strong entry at ₹1,149, supported by impressive momentum and extremely high volume. The candle structure confirms aggressive buying interest, indicating renewed confidence in the stock. The stop loss is placed at ₹1,028.35, offering a defined risk of ₹120.65 per share, which keeps the trade well-balanced. This move also coincides with a master level of ₹1,084.59, now acting as a solid support zone. The surge in price, combined with high volume participation, validates the breakout strength and suggests potential for follow-through in the next trading session. On the upside, the price could face immediate resistance at ₹1,166.73, followed by ₹1,189.67 and ₹1,230.33, which will serve as profit-booking zones if the momentum sustains. Meanwhile, possible support levels are positioned at ₹1,103.13, ₹1,062.47, and ₹1,039.53, giving the setup a strong base for any short-term pullback. The surge in price and volume validates this breakout’s strength, suggesting potential continuation towards higher resistances in the near term. The volume spike of nearly 6 million indicates institutional participation, validating the strength of the breakout. Key support levels are placed at ₹1,105 (23.6% retracement) and ₹1,018 (base support), offering a solid foundation for the ongoing uptrend. On the upside, immediate resistance lies around ₹1,160 (38.2% level), followed by ₹1,203 (50%), ₹1,247 (61.8%), and ₹1,309 (78.6%) — these Fibonacci levels will act as potential profit-booking zones if momentum sustains. With the RSI and CCI both showing bullish crossovers, and momentum indicators confirming strength, the price action suggests a continuation pattern towards ₹1,200+ levels in the near term.
________________________________________
KFin Technologies has delivered a strong bullish breakout right from its bottom range support near ₹1,018.7, confirming renewed buying interest after a prolonged consolidation phase. The stock has respected its lower demand zone multiple times, and this recent breakout comes with a powerful surge in volume (~6M) — a strong sign of accumulation and institutional participation. On a broader structure, the stock continues to trade within a wide range between ₹1,018 (bottom) and ₹1,378 (top) — and a sustained move above the mid-range resistance can open the path toward the upper band. This price behavior, combined with strong momentum indicators and high volume, signals the potential beginning of a range-to-range rally in the coming sessions.
________________________________________
Final Outlook:
Momentum: Strong | Trend: Bullish | Risk: Moderate | Volume: High
________________________________________
💡 Learning Note
This setup demonstrates the power of combining price action, Fibonacci levels, and volume confirmation. A bullish breakout supported by heavy volume, indicator alignment, and a clean structure often offers one of the most reliable swing trade frameworks. Pullbacks into fib-based demand zones followed by renewed buying are high-probability continuation setups.
________________________________________
⚠️ Disclosure & Disclaimer – Please Read Carefully
The information shared here is meant purely for learning and awareness. It is not a buy or sell recommendation and should not be taken as investment advice. I am not a SEBI-registered investment adviser, and all views expressed are based on personal study, chart patterns, and publicly available market data.
Trading—whether in stocks or options—carries risk. Markets can move unexpectedly, and losses can sometimes exceed the money you have invested. Past performance or past setups do not guarantee future results.
If you are a beginner, treat this as a guide to understand how the market works and practice on paper trades before risking real money. If you are experienced, always assess your own risk, position sizing, and strategy suitability before entering trades.
Consult a SEBI-registered financial adviser before making any real trading decision. By engaging with this content, you acknowledge full responsibility for your trades and investments.
Position Status: No active position in KFINTECH at the time of analysis.
Data Source: TradingView & NSE India (Past Chart Reference) (Historical levels)
💬 Found this useful?
🔼 Give this post a Boost to help more traders discover clean, structured learning.
✍️ Drop your thoughts, questions, or setups in the comments — let’s grow together!
🔁 Share with fellow traders and beginners to spread awareness.
👉 “If you liked this breakdown, follow for more clean, structured setups with discipline at the core.”
🚀 Stay Calm. Stay Clean. Trade With Patience.
Trade Smart | Learn Zones | Be Self-Reliant 📊
Order cancelled
STWP | Mentor & Demand-Supply Specialist | Empowering traders through structured learning |
simpletradewithpatience.com
Community: chat.whatsapp.com/BEYz0tkqP0fJPBCWf59uel
wa.me/message/6IOPHGOXMGZ4N1
Educational Only
simpletradewithpatience.com
Community: chat.whatsapp.com/BEYz0tkqP0fJPBCWf59uel
wa.me/message/6IOPHGOXMGZ4N1
Educational Only
Disclaimer
The information and publications are not meant to be, and do not constitute, financial, investment, trading, or other types of advice or recommendations supplied or endorsed by TradingView. Read more in the Terms of Use.