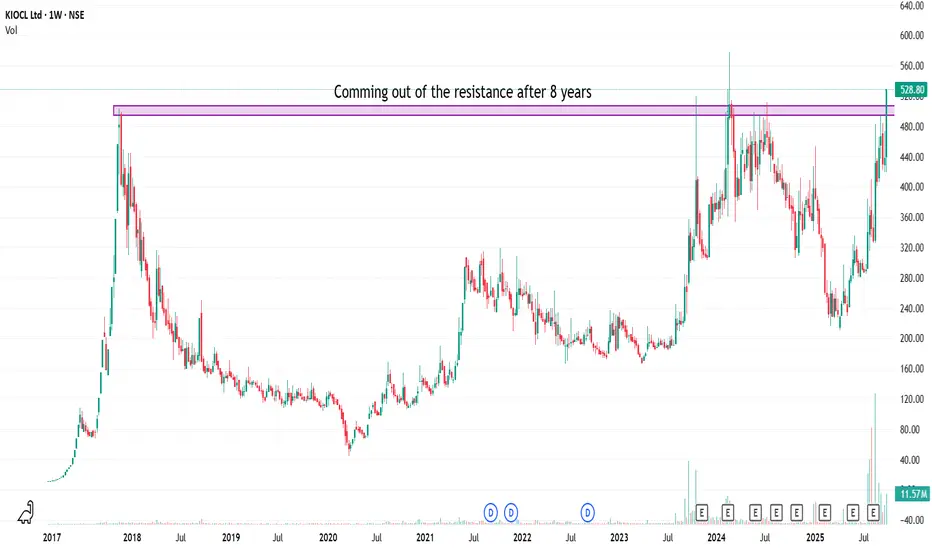
Chart is KIOCL weekly chart.
KIOCL is coming out of the long-term resistance of 8 years on closing basis with good volume .
Can be in watchlist for next few weeks. If holds above the zone of 475 to 500, can move further up.
Caution : Fundamentals are not as good as technical.
KIOCL is coming out of the long-term resistance of 8 years on closing basis with good volume .
Can be in watchlist for next few weeks. If holds above the zone of 475 to 500, can move further up.
Caution : Fundamentals are not as good as technical.
Disclaimer
The information and publications are not meant to be, and do not constitute, financial, investment, trading, or other types of advice or recommendations supplied or endorsed by TradingView. Read more in the Terms of Use.
Disclaimer
The information and publications are not meant to be, and do not constitute, financial, investment, trading, or other types of advice or recommendations supplied or endorsed by TradingView. Read more in the Terms of Use.