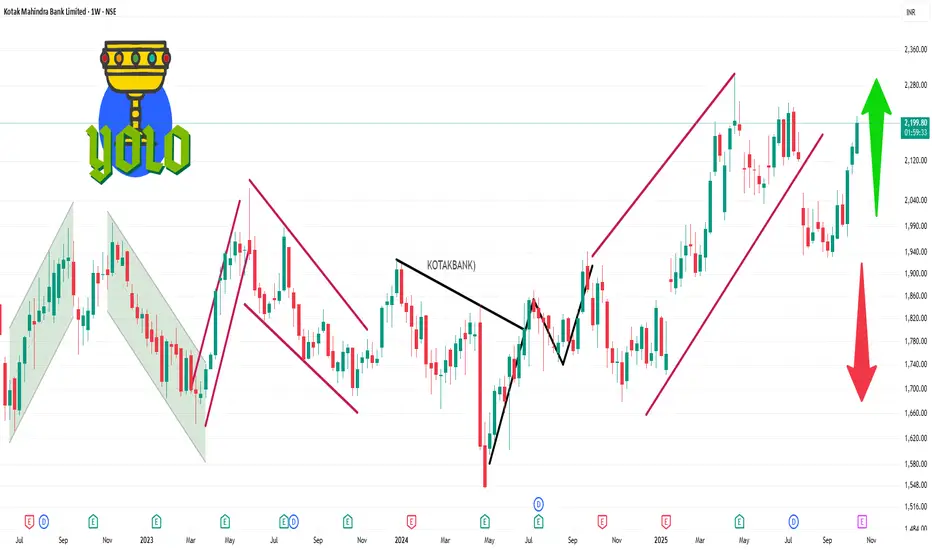
📊 Weekly Support and Resistance Levels
Immediate Support Levels: ₹2,109.47, ₹2,068.83, ₹2,044.67
Immediate Resistance Levels: ₹2,174.27, ₹2,198.43, ₹2,239.07
A decisive move above ₹2,174.27 could signal a bullish breakout, while a drop below ₹2,109.47 may indicate a bearish trend.
📈 Technical Indicators Summary
RSI (14): 73.44 — Indicates potential overbought conditions.
MACD: 46.92 — Suggests bullish momentum.
ADX (14): 32.50 — Reflects a strong trend.
EMA (5): ₹2,176.59 — Indicates short-term bullishness.
EMA (50): ₹2,067.60 — Supports medium-term bullish outlook.
EMA (200): ₹2,057.89 — Confirms long-term bullish trend.
Related publications
Disclaimer
The information and publications are not meant to be, and do not constitute, financial, investment, trading, or other types of advice or recommendations supplied or endorsed by TradingView. Read more in the Terms of Use.
Related publications
Disclaimer
The information and publications are not meant to be, and do not constitute, financial, investment, trading, or other types of advice or recommendations supplied or endorsed by TradingView. Read more in the Terms of Use.