📊 KSCL – Technical & Educational Snapshot
Ticker: NSE: KSCL | Sector: 🌱 Seeds & Agro
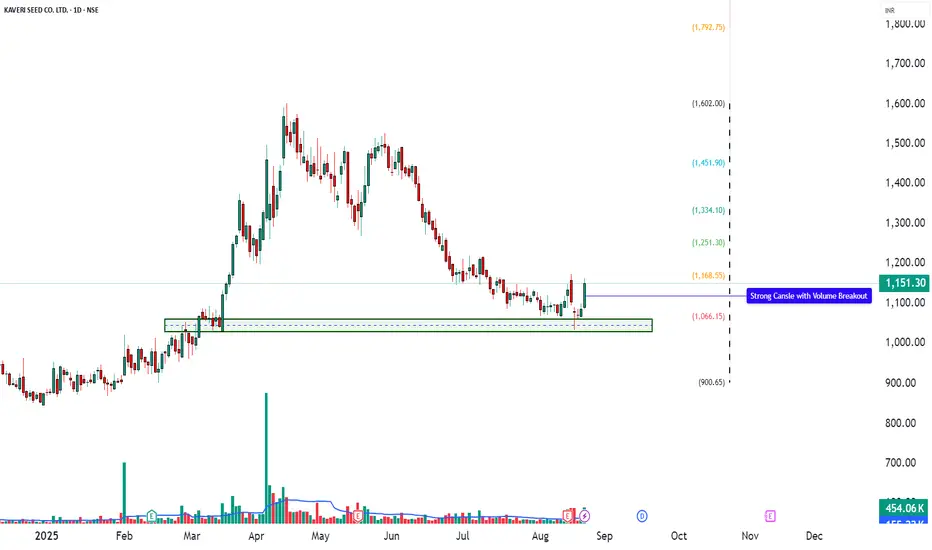
CMP: ₹1,151.30 ▲ (as of 21 Aug 2025)
Rating (for learning purpose): ⭐⭐⭐⭐
Pattern Observed: 📉 Double Top + Descending Wedge (target near ₹1,000 completed)

KSCL earlier formed a Double Top followed by a Descending Wedge breakdown, with the projected bearish reference zone being successfully achieved. With that completion, the stock has now entered a new phase, displaying fresh bullish momentum. A strong bullish candle, RSI breakout, and Bollinger Band expansion from a squeeze highlight renewed buying strength.
This technical shift points towards a possible trend reversal or at least a medium-term bounce, provided the price sustains above key resistance levels. Supporting indicators (MACD, CCI, Stochastic) are aligned in favor of momentum continuation, adding weight to the bullish case.
📊 Momentum Snapshot:
Momentum indicators are tilting to the bullish side. While Stochastic (84) is moderately elevated, the confluence of RSI breakout, MACD bullish crossover, and strong CCI indicates that momentum could sustain until higher resistance levels are tested.
📊 Volume Check
🔹 Current Volume: 454.06K
🔹 20 SMA Volume: 155.22K ✅
💥 Nearly 3x average volume – confirms strong institutional / broad-based buying interest!
💡 Interpretation:
When volume is well above the 20-period average, it strengthens the reliability of a breakout.
This shows the move is not just retail-driven but likely backed by larger participants.
High-volume breakouts tend to sustain better compared to low-volume moves.
💡 Learnings:
Breakouts emerging from a Bollinger Band Squeeze often lead to strong trending moves as volatility expands. When supported by confirmations such as RSI and MACD turning positive together, the reliability of the breakout improves significantly.
Elevated CCI values reflect strong buying momentum, though traders should remain mindful of possible pullbacks. Above all, defining clear stop-loss and invalidation levels ensures disciplined trade management.
📌 Fresh bullish signals are emerging → but confirmation only comes on sustained move above ₹1,180–1,209. Failure to hold above ₹1,100 may keep it in sideways consolidation or trigger further downward pressure.
🔑 Key Levels
Resistance: 1180 | 1209 | 1256
Support: 1104 | 1057 | 1028
Fibonacci Levels: 900.65 | 1066.15 | 1168.55 | 1251.30 | 1334.10 | 1451.90 | 1602
Pullback Level: Around 1104–1110 zone (first support & prior base)
Invalidation Level: Close below 1057 (would negate the bullish setup)
📝 STWP Trade Setup
📌 Entry (Long): Above 1,162
🛡 Stop Loss: 1,059 or below
🎯 Reference Levels: 1264 | 1366
⚠️ Disclaimer – Please Read Carefully
The information shared here is meant purely for learning and awareness. It is not a buy or sell recommendation and should not be taken as investment advice. I am not a SEBI-registered investment advisor, and all views expressed are based on personal study, chart patterns, and publicly available market data.
Trading — whether in stocks or options — carries risk. Markets can move unexpectedly, and losses can sometimes exceed the money you have invested. Past performance or past setups do not guarantee future results.
If you are a beginner, treat this as a guide to understand how the market works — practice on paper trades before risking real money. If you are experienced, always assess your own risk, position sizing, and strategy suitability before entering trades.
Consult a SEBI-registered financial advisor before making any real trading decision. By engaging with this content, you acknowledge full responsibility for your trades and investments.
💬 Found this useful?
🔼 Give this post a Boost to help more traders discover clean, structured learning.
✍️ Drop your thoughts, questions, or setups in the comments — let’s grow together!
🔁 Share with fellow traders and beginners to spread awareness.
✅ Follow simpletradewithpatience for beginner-friendly setups, price action insights & disciplined trading content.
🚀 Stay Calm. Stay Clean. Trade With Patience.
Trade Smart | Learn Zones | Be Self-Reliant 📊
Ticker: NSE: KSCL | Sector: 🌱 Seeds & Agro
CMP: ₹1,151.30 ▲ (as of 21 Aug 2025)
Rating (for learning purpose): ⭐⭐⭐⭐
Pattern Observed: 📉 Double Top + Descending Wedge (target near ₹1,000 completed)
KSCL earlier formed a Double Top followed by a Descending Wedge breakdown, with the projected bearish reference zone being successfully achieved. With that completion, the stock has now entered a new phase, displaying fresh bullish momentum. A strong bullish candle, RSI breakout, and Bollinger Band expansion from a squeeze highlight renewed buying strength.
This technical shift points towards a possible trend reversal or at least a medium-term bounce, provided the price sustains above key resistance levels. Supporting indicators (MACD, CCI, Stochastic) are aligned in favor of momentum continuation, adding weight to the bullish case.
📊 Momentum Snapshot:
Momentum indicators are tilting to the bullish side. While Stochastic (84) is moderately elevated, the confluence of RSI breakout, MACD bullish crossover, and strong CCI indicates that momentum could sustain until higher resistance levels are tested.
📊 Volume Check
🔹 Current Volume: 454.06K
🔹 20 SMA Volume: 155.22K ✅
💥 Nearly 3x average volume – confirms strong institutional / broad-based buying interest!
💡 Interpretation:
When volume is well above the 20-period average, it strengthens the reliability of a breakout.
This shows the move is not just retail-driven but likely backed by larger participants.
High-volume breakouts tend to sustain better compared to low-volume moves.
💡 Learnings:
Breakouts emerging from a Bollinger Band Squeeze often lead to strong trending moves as volatility expands. When supported by confirmations such as RSI and MACD turning positive together, the reliability of the breakout improves significantly.
Elevated CCI values reflect strong buying momentum, though traders should remain mindful of possible pullbacks. Above all, defining clear stop-loss and invalidation levels ensures disciplined trade management.
📌 Fresh bullish signals are emerging → but confirmation only comes on sustained move above ₹1,180–1,209. Failure to hold above ₹1,100 may keep it in sideways consolidation or trigger further downward pressure.
🔑 Key Levels
Resistance: 1180 | 1209 | 1256
Support: 1104 | 1057 | 1028
Fibonacci Levels: 900.65 | 1066.15 | 1168.55 | 1251.30 | 1334.10 | 1451.90 | 1602
Pullback Level: Around 1104–1110 zone (first support & prior base)
Invalidation Level: Close below 1057 (would negate the bullish setup)
📝 STWP Trade Setup
📌 Entry (Long): Above 1,162
🛡 Stop Loss: 1,059 or below
🎯 Reference Levels: 1264 | 1366
⚠️ Disclaimer – Please Read Carefully
The information shared here is meant purely for learning and awareness. It is not a buy or sell recommendation and should not be taken as investment advice. I am not a SEBI-registered investment advisor, and all views expressed are based on personal study, chart patterns, and publicly available market data.
Trading — whether in stocks or options — carries risk. Markets can move unexpectedly, and losses can sometimes exceed the money you have invested. Past performance or past setups do not guarantee future results.
If you are a beginner, treat this as a guide to understand how the market works — practice on paper trades before risking real money. If you are experienced, always assess your own risk, position sizing, and strategy suitability before entering trades.
Consult a SEBI-registered financial advisor before making any real trading decision. By engaging with this content, you acknowledge full responsibility for your trades and investments.
💬 Found this useful?
🔼 Give this post a Boost to help more traders discover clean, structured learning.
✍️ Drop your thoughts, questions, or setups in the comments — let’s grow together!
🔁 Share with fellow traders and beginners to spread awareness.
✅ Follow simpletradewithpatience for beginner-friendly setups, price action insights & disciplined trading content.
🚀 Stay Calm. Stay Clean. Trade With Patience.
Trade Smart | Learn Zones | Be Self-Reliant 📊
STWP | Mentor & Demand-Supply Specialist | Empowering traders through structured learning |
simpletradewithpatience.com
Community: chat.whatsapp.com/BEYz0tkqP0fJPBCWf59uel
wa.me/message/6IOPHGOXMGZ4N1
Educational Only
simpletradewithpatience.com
Community: chat.whatsapp.com/BEYz0tkqP0fJPBCWf59uel
wa.me/message/6IOPHGOXMGZ4N1
Educational Only
Disclaimer
The information and publications are not meant to be, and do not constitute, financial, investment, trading, or other types of advice or recommendations supplied or endorsed by TradingView. Read more in the Terms of Use.