📊 Chainlink (
 LINKUSDT) Retesting Mid-Range Resistance Within a Healthy Uptrend
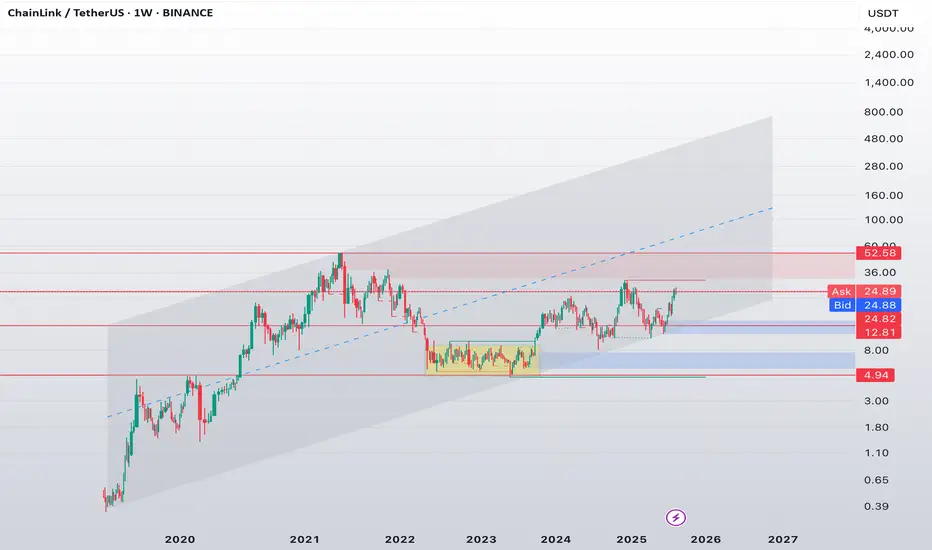
On the weekly chart,LINK continues to maintain a clear higher low structure, currently retesting the critical resistance area around $25 — a level that historically capped upside in prior cycles.
🔍 Structural Highlights:
🔲The accumulation zone ($5–9) lasted over 500 days and ended with a breakout in late 2023
🔵 $12.80 held as a key higher low, validating the breakout structure
📈 Price is now approaching the $24–26 resistance — a historically significant supply zone that acted as a pivot point during 2021–2022
🧭 Scenarios I’m watching:
✅ Bullish case:
A confirmed breakout above $26 with weekly close ➝ opens the door toward $34–38 (next major supply block)
On macro strength, eventual extension toward $52 remains technically viable
❌ Bearish case:
Rejection at $25 ➝ pullback toward $18.50–$20 range for another higher low and continuation setup
🔬 Trend Dynamics:
Price is tracking inside a long-term ascending channel from the 2020 cycle
Current structure sits around the midline of the channel, which often acts as equilibrium or resistance in trend development
📌 My take:
LINK has completed its accumulation → expansion transition and is entering a more directional phase.
As long as we remain above $20, the macro structure stays bullish. But I’m not rushing into resistance at $25 — waiting for confirmation.
#LINK #Chainlink #CryptoAnalysis #TradingView #Altcoins #TechnicalOutlook #MacroStructure #MarketCycle
On the weekly chart,
🔍 Structural Highlights:
🔲The accumulation zone ($5–9) lasted over 500 days and ended with a breakout in late 2023
🔵 $12.80 held as a key higher low, validating the breakout structure
📈 Price is now approaching the $24–26 resistance — a historically significant supply zone that acted as a pivot point during 2021–2022
🧭 Scenarios I’m watching:
✅ Bullish case:
A confirmed breakout above $26 with weekly close ➝ opens the door toward $34–38 (next major supply block)
On macro strength, eventual extension toward $52 remains technically viable
❌ Bearish case:
Rejection at $25 ➝ pullback toward $18.50–$20 range for another higher low and continuation setup
🔬 Trend Dynamics:
Price is tracking inside a long-term ascending channel from the 2020 cycle
Current structure sits around the midline of the channel, which often acts as equilibrium or resistance in trend development
📌 My take:
As long as we remain above $20, the macro structure stays bullish. But I’m not rushing into resistance at $25 — waiting for confirmation.
#LINK #Chainlink #CryptoAnalysis #TradingView #Altcoins #TechnicalOutlook #MacroStructure #MarketCycle
Telegram Channel⏩ t.me/+aTlXBWnLy2Y4OTQ6
🔥Trade cryptocurrency on the exchange Bybit - partner.bybit.com/b/94881
🔥Trade cryptocurrency on the exchange Bybit - partner.bybit.com/b/94881
Disclaimer
The information and publications are not meant to be, and do not constitute, financial, investment, trading, or other types of advice or recommendations supplied or endorsed by TradingView. Read more in the Terms of Use.