🚨 LLY Ready to Break Out? Here's What the Chart Tells Us
Back in November 2024, we shared an idea warning that Eli Lilly (LLY) was facing some serious headwinds.

Since then, the market has confirmed it, LLY has spent nearly a year moving sideways, showing little strength to push the stock higher.
But that period of consolidation may be coming to an end.
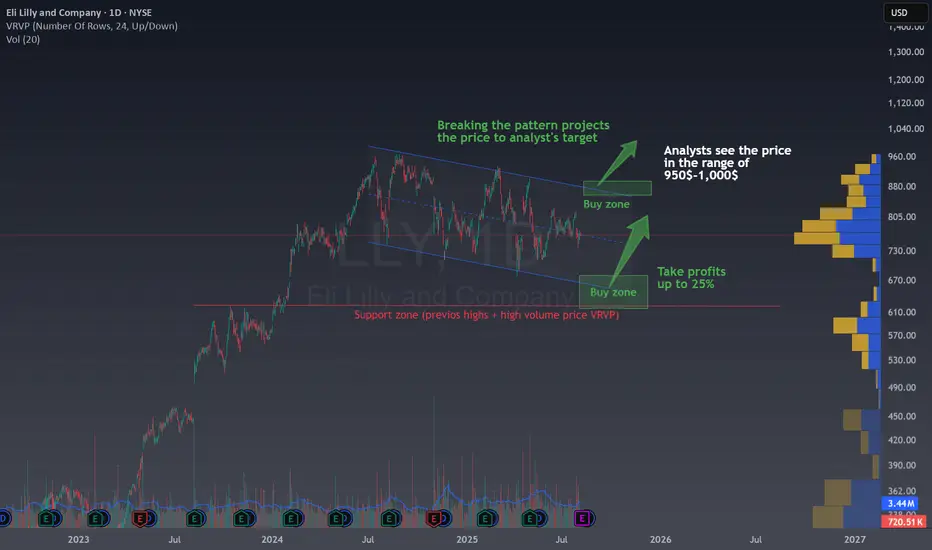
Right now,LLY is forming a classic flag (or channel) pattern in the middle of a longer-term bullish trend. Technically speaking, a breakout to the upside would project the price directly into the analyst consensus target, which currently ranges between $950 and $1,000.
That would be a strong continuation of the long-term uptrend!
However, even without a breakout, this chart offers attractive trading opportunities inside the pattern. Buying near the bottom of the channel and selling near the top could yield gains of up to 25%, all while keeping risk low. Why? Because we can clearly define a support zone (shown in red) based on previous highs and high VRVP volume, which gives us a logical stop-loss area.
📈 Let’s not forget: LLY has already corrected around 30% from its all-time highs, and if price drops to the lower buy zone, that discount could increase to 35%, a level many long-term investors would find very attractive.
Analyst sentiment remains strong, with a "Strong Buy" consensus rating and price targets nearing $1,000, making this setup one worth watching closely.
💬 Does this setup align with your view onLLY?
🚀 Hit the rocket if this helped you spot the opportunity and follow for more Chart Patterns and educational trade ideas!
Back in November 2024, we shared an idea warning that Eli Lilly (LLY) was facing some serious headwinds.
Since then, the market has confirmed it,
But that period of consolidation may be coming to an end.
Right now,
That would be a strong continuation of the long-term uptrend!
However, even without a breakout, this chart offers attractive trading opportunities inside the pattern. Buying near the bottom of the channel and selling near the top could yield gains of up to 25%, all while keeping risk low. Why? Because we can clearly define a support zone (shown in red) based on previous highs and high VRVP volume, which gives us a logical stop-loss area.
📈 Let’s not forget: LLY has already corrected around 30% from its all-time highs, and if price drops to the lower buy zone, that discount could increase to 35%, a level many long-term investors would find very attractive.
Analyst sentiment remains strong, with a "Strong Buy" consensus rating and price targets nearing $1,000, making this setup one worth watching closely.
💬 Does this setup align with your view on
🚀 Hit the rocket if this helped you spot the opportunity and follow for more Chart Patterns and educational trade ideas!
⚡ Trading is not about luck or patience. Is about skills and knowledge. ⚡
I share my ideas, returns and knowledge here:
📚 👉 topchartpatterns.substack.com/subscribe 👈📚
🤝 Business contact: info@topchartpatterns.com
I share my ideas, returns and knowledge here:
📚 👉 topchartpatterns.substack.com/subscribe 👈📚
🤝 Business contact: info@topchartpatterns.com
Related publications
Disclaimer
The information and publications are not meant to be, and do not constitute, financial, investment, trading, or other types of advice or recommendations supplied or endorsed by TradingView. Read more in the Terms of Use.