📌 LTC/USDT Analysis – Weekly Timeframe
Litecoin has consistently shown positive reactions to this major support zone over the past years. This level has repeatedly prevented deeper declines and remains one of the strongest historical supports for LTC.
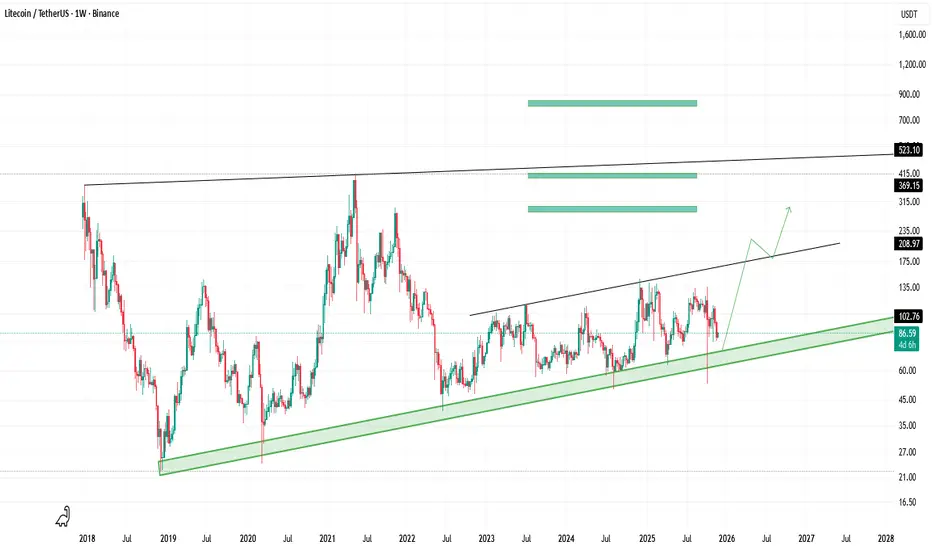
🔹 Key Resistance Levels
Heavy resistance: around $180
Historical resistance: around $450
🔹 Green Zones: Targets
Based on the current market structure, the green highlighted areas represent potential upside targets:
Target 1: $280 – $300
Target 2: $400 – $420
Target 3: $800 – $830
🔹 Important Structural Similarity
The current LTC structure shows a strong similarity to XRP’s chart before its major breakout, where price spent a long period consolidating and repeatedly reacting to a critical support zone.
🔹 Suggested Buying Strategy
Considering the consistent reactions to this support, a laddered (DCA) buying approach may be a more suitable strategy to manage risk effectively.
⚠️ Disclaimer:
This is only a personal opinion and not a buy or sell signal
Litecoin has consistently shown positive reactions to this major support zone over the past years. This level has repeatedly prevented deeper declines and remains one of the strongest historical supports for LTC.
🔹 Key Resistance Levels
Heavy resistance: around $180
Historical resistance: around $450
🔹 Green Zones: Targets
Based on the current market structure, the green highlighted areas represent potential upside targets:
Target 1: $280 – $300
Target 2: $400 – $420
Target 3: $800 – $830
🔹 Important Structural Similarity
The current LTC structure shows a strong similarity to XRP’s chart before its major breakout, where price spent a long period consolidating and repeatedly reacting to a critical support zone.
🔹 Suggested Buying Strategy
Considering the consistent reactions to this support, a laddered (DCA) buying approach may be a more suitable strategy to manage risk effectively.
⚠️ Disclaimer:
This is only a personal opinion and not a buy or sell signal
Disclaimer
The information and publications are not meant to be, and do not constitute, financial, investment, trading, or other types of advice or recommendations supplied or endorsed by TradingView. Read more in the Terms of Use.
Disclaimer
The information and publications are not meant to be, and do not constitute, financial, investment, trading, or other types of advice or recommendations supplied or endorsed by TradingView. Read more in the Terms of Use.