📊 L&T Finance Ltd – Detailed Technical Analysis
1️⃣ Pattern Overview
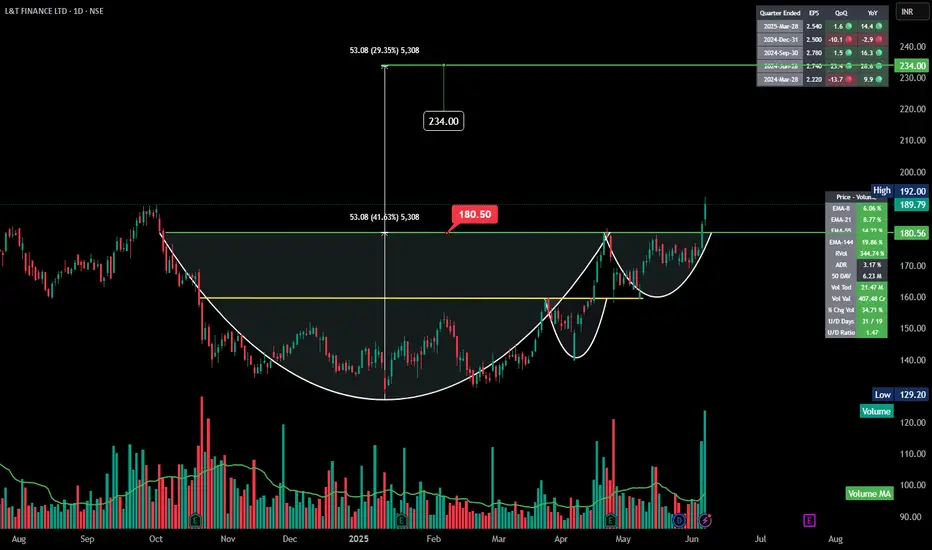
The chart shows a classic Cup and Handle pattern that has recently broken out above the 180.50 neckline.
Cup and Handle patterns are bullish continuation patterns, suggesting a measured move to the upside after the breakout.
2️⃣ Breakout Details
Breakout Level: 180.50
Current Price: 189.79 (up 3.51% on breakout volume)
The breakout is confirmed by a strong bullish candle with a solid close above 180.50.
3️⃣ Price Target Calculation
The measured move is equal to the depth of the cup (approx. 53 points).
Target: 180.50 (breakout) + 53 = 234.00
This target is also reinforced by historical resistance around this level.
4️⃣ Volume Analysis
Noticeable volume spike on the breakout day, confirming strong buying interest.
Volume MA also rising, supporting the breakout’s validity.
5️⃣ Moving Averages & Momentum
EMA-8 / EMA-21 / EMA-55 / EMA-144: All EMAs have bullish slopes.
Short-term EMAs (8/21) are above longer EMAs (55/144), confirming a strong uptrend.
Momentum indicators like the RSI (not shown here, but generally above 60) further support bullish bias.
6️⃣ Support & Resistance Levels
Immediate Support: 180.50 (breakout level)
Major Support: 129.20 (previous low, Cup’s bottom)
Immediate Resistance: None until the target zone near 234.00
7️⃣ Volume Trend
Strong volumes on the breakout bar – a sign that institutional or smart money is likely involved.
Volume MA rising, suggesting sustained accumulation.
8️⃣ Risk Management
Ideal stop-loss can be placed below 180.50 or near EMA-21 (around 175).
Watch for potential pullbacks to the breakout level – healthy retests can offer re-entry opportunities.
1️⃣ Pattern Overview
The chart shows a classic Cup and Handle pattern that has recently broken out above the 180.50 neckline.
Cup and Handle patterns are bullish continuation patterns, suggesting a measured move to the upside after the breakout.
2️⃣ Breakout Details
Breakout Level: 180.50
Current Price: 189.79 (up 3.51% on breakout volume)
The breakout is confirmed by a strong bullish candle with a solid close above 180.50.
3️⃣ Price Target Calculation
The measured move is equal to the depth of the cup (approx. 53 points).
Target: 180.50 (breakout) + 53 = 234.00
This target is also reinforced by historical resistance around this level.
4️⃣ Volume Analysis
Noticeable volume spike on the breakout day, confirming strong buying interest.
Volume MA also rising, supporting the breakout’s validity.
5️⃣ Moving Averages & Momentum
EMA-8 / EMA-21 / EMA-55 / EMA-144: All EMAs have bullish slopes.
Short-term EMAs (8/21) are above longer EMAs (55/144), confirming a strong uptrend.
Momentum indicators like the RSI (not shown here, but generally above 60) further support bullish bias.
6️⃣ Support & Resistance Levels
Immediate Support: 180.50 (breakout level)
Major Support: 129.20 (previous low, Cup’s bottom)
Immediate Resistance: None until the target zone near 234.00
7️⃣ Volume Trend
Strong volumes on the breakout bar – a sign that institutional or smart money is likely involved.
Volume MA rising, suggesting sustained accumulation.
8️⃣ Risk Management
Ideal stop-loss can be placed below 180.50 or near EMA-21 (around 175).
Watch for potential pullbacks to the breakout level – healthy retests can offer re-entry opportunities.
Disclaimer
The information and publications are not meant to be, and do not constitute, financial, investment, trading, or other types of advice or recommendations supplied or endorsed by TradingView. Read more in the Terms of Use.
Disclaimer
The information and publications are not meant to be, and do not constitute, financial, investment, trading, or other types of advice or recommendations supplied or endorsed by TradingView. Read more in the Terms of Use.