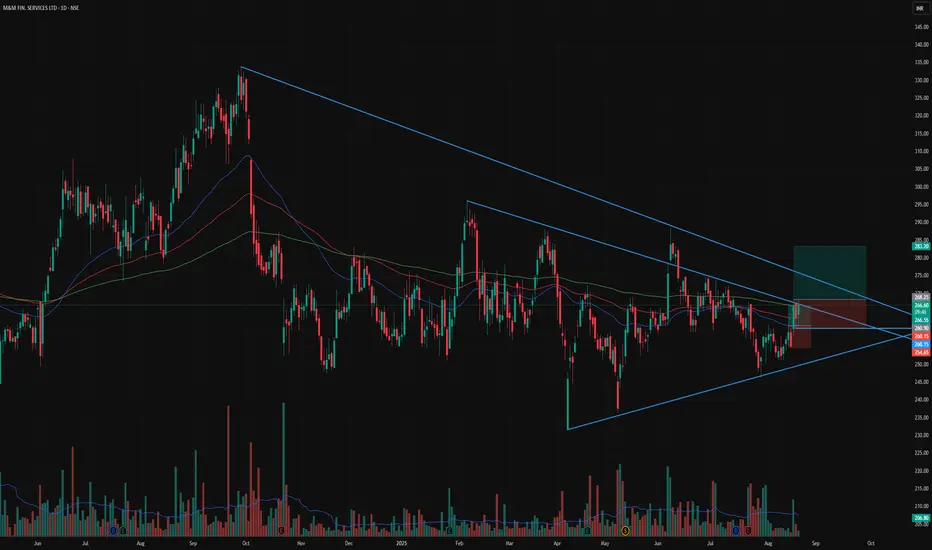
📊 Stock: M&M Financial Services (M&MFIN)
🔹 Symmetrical triangle pattern forming – price squeezing into apex
🔹 Strong bounce from lower trendline with rising volume
🔹 Trading above 50 DMA & 100 DMA – short-term trend improving
🔹 200 DMA resistance near ₹268–270 being tested
🔹 RSI showing strength
🔹 Good support zone at ₹250–255
🔹 Strong financial backing as part of M&M Group
⚡ Price nearing breakout zone (₹268–270)
🚀 Breakout above 268 can trigger a rally towards ₹283–300
⚠️ Support at ₹250 – below this trend may weaken
Disclaimer
The information and publications are not meant to be, and do not constitute, financial, investment, trading, or other types of advice or recommendations supplied or endorsed by TradingView. Read more in the Terms of Use.
Disclaimer
The information and publications are not meant to be, and do not constitute, financial, investment, trading, or other types of advice or recommendations supplied or endorsed by TradingView. Read more in the Terms of Use.